Map shows where you are most likely to spot a UFO in the UK

Following a series of reported sightings of unidentified flying objects in the United States and Canada in the past month, UFO enthusiasts across the United Kingdom have been on the lookout for extraordinary UFO activity. Within a two week span, U.S. fighter jets shot down four objects over North America, and only one was confirmed to be a Chinese spy balloon.

The nature of the other three, however, remains unknown, giving rise to various theories about the purpose and origins of these flying objects. Were they weather balloons, balloons for commercial use, or possibly spy aircraft? Were they man-made or extra-terrestrial? As ufologists on both sides of the Atlantic are studying these incidents and coming up with different explanations, the team at BonusInsider decided to analyse UFO sightings in the UK over the past year. Using data from UFO Identified and their UK UFO Report 2022, we created a map of the counties where you are most likely to spot a UFO.

Research Balloons, Spy Aircraft, or UFOs?

The mystery surrounding the three unidentified objects over North America has yet to be solved. Several agencies from Canada and the U.S. conducted “systematic searches” over Alaska, Lake Huron, and the Yukon for a week, but were unable to spot anything of interest, and abandoned the search for the three flying objects after finding no debris.

Ufologists warn that alien origin cannot be excluded, since these objects were of various shapes and sizes, and it is unclear how they were able to fly at such high altitudes. Were they manually steered, or did they float?. One object had an octagonal shape, quite unusual for a balloon, while another was cylindrical.

  • 4 February 2023 – balloon shot by an F-22 fighter jet off the coast of Myrtle Beach, South Carolina at an altitude of 60,000 ft (18 km)
  • 10 February 2023 – unidentified object shot down near Deadhorse, Alaska, altitude of 40,000 ft (12 km)
  • 11 February 2023 – unidentified object shot down above Central Yukon, altitude of 40,000 ft (12 km)
  • 12 February 2023 – unidentified object shot down above Lake Huron, altitude of 20,000 ft (6 km)

There have been concerns that similar objects might also be spotted in the skies above the UK. Following the incidents across the pond, Defence Secretary Ben Wallace has ordered a security review, while in an interview for Sky News, transport minister Richard Holden admitted that China may have launched spy balloons over Britain. Prime Minister Rishi Sunak said that the government will do “whatever it takes” to keep the UK safe.

UK Saw Nearly 500 UFOs in 2022

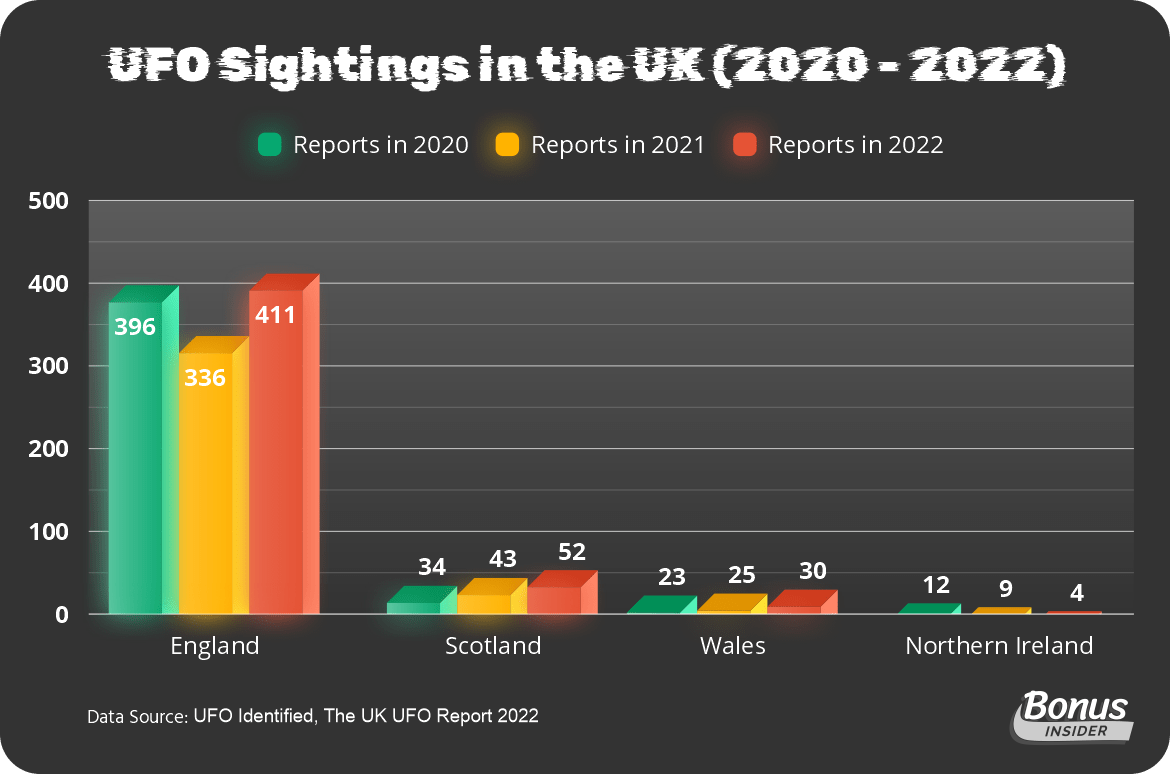
UFOs, or unidentified flying objects, have been capturing our imagination for over 70 years. Recently, they have been rebranded as unidentified aerial phenomena or UAPs but are still most commonly referred to as UFOs. According to the organization UFO Identified, which gathered data from local and national media, as well as FOI (Freedom of Information) requests, a total of 497 UFO sightings have been reported across England, Wales, Scotland and Northern Ireland in 2022.

In comparison, there were 465 sightings in 2020 and 413 in 2021, which means that people saw more unexplained phenomena last year than they previously had. In fact, there has been an increase in sightings across all countries, with the exception of Northern Ireland.

Some of the reports in 2020 can be explained by the launch of the Star Link internet satellites, the SpaceX project that started back in 2019. In March and April of 2020, there were multiple posts and videos of the satellites on Twitter as British skywatchers asked what this “train of lights” could be. Later, it was confirmed that the objects were, in fact, Elon Musk’s satellites, which were clearly visible in the night sky over Essex and other parts of the UK.

Interestingly, the most likely time to spot a UFO is between 9 pm and 10 pm and on Saturdays. This specific timing could be explained by the fact that most people work during the day, from Monday to Friday. Consequently, they only have time to watch the skies in the evenings and at weekends. Also, satellites, drones, and other objects that blink or have any sort of lights are much more visible at night.

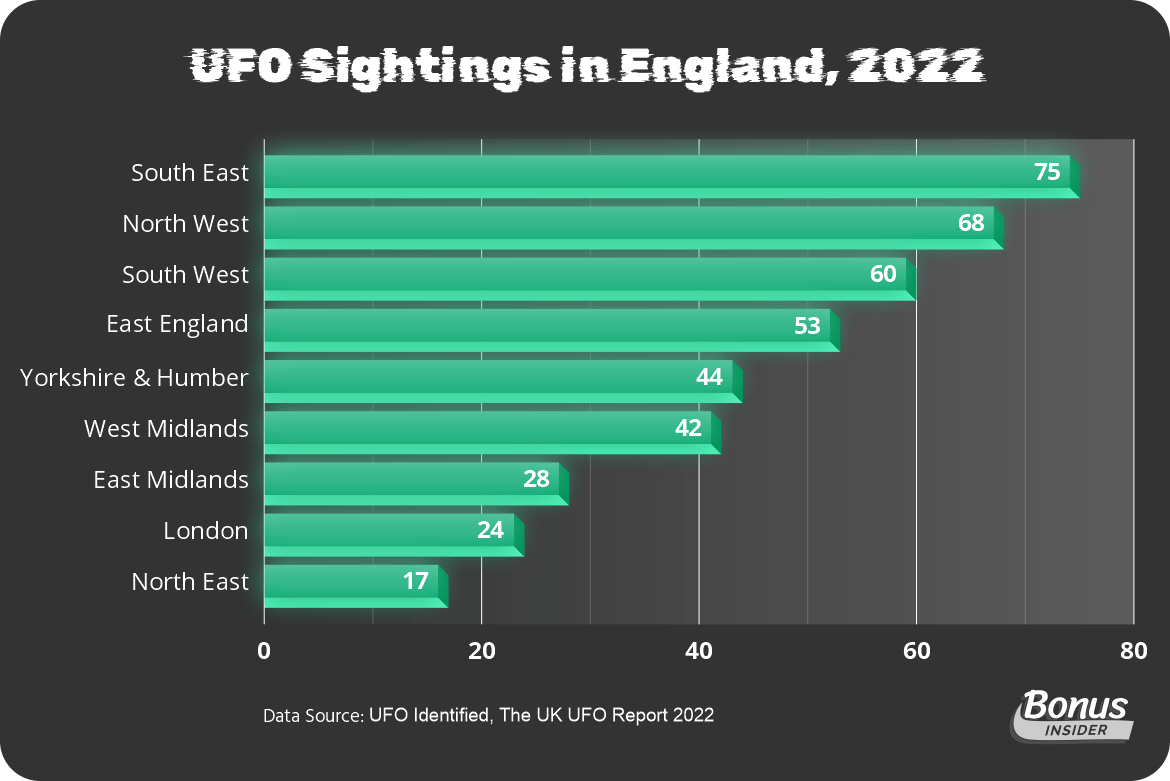
Data also show that the regions where the most UFO sightings were reported in 2022 were the South East with 75 reports, the North West with 68 reports, and the South West with 60 reports.

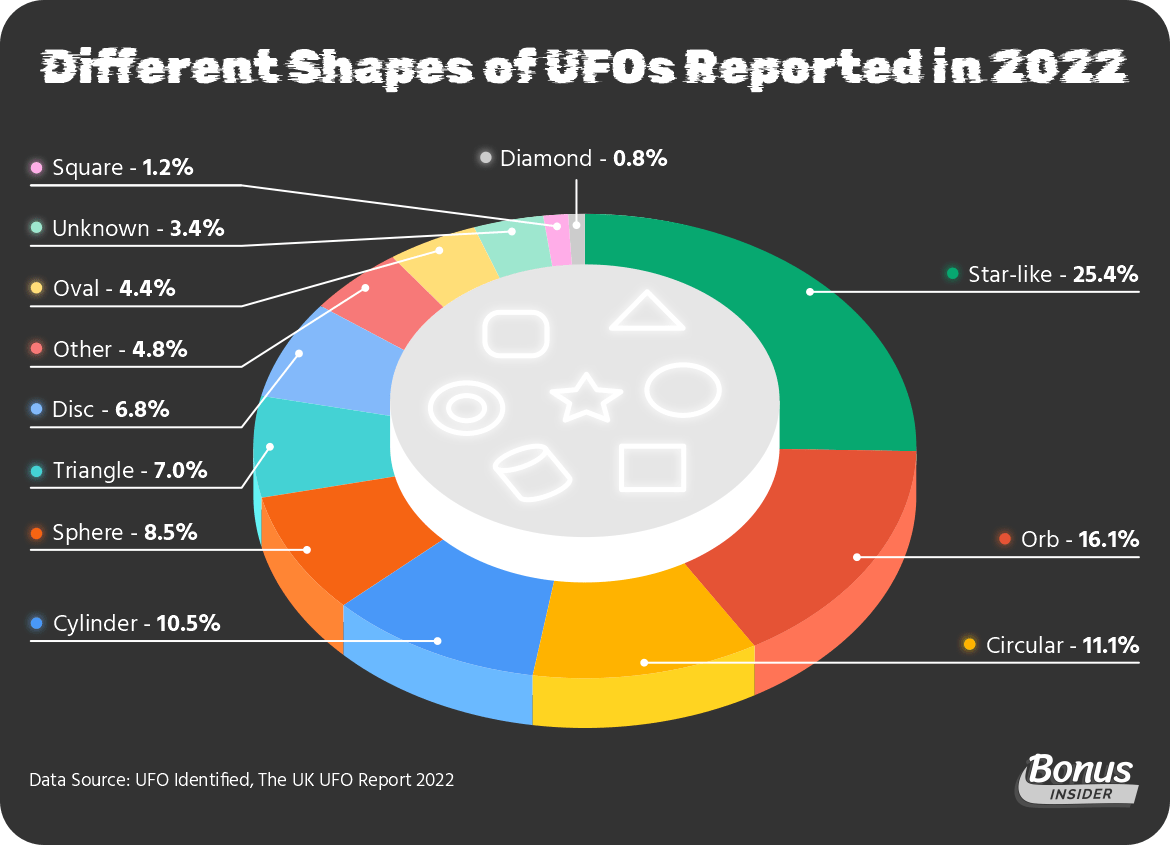
UFOs: What Do They Look Like?

Flying saucers are not the only type of UFO seen in the sky. In fact, witnesses are describing various shapes, including orbs, cylinders, spheres, and a multitude of other forms. According to the data for 2022, the most commonly reported UFO was “star-like”, as described in 126 reports. Other common shapes were “orb” (80 reports), “circular” (55 reports), “cylinder” (52 reports), “sphere” (42 reports), and “triangle” (35 reports). Saucers or “discs”, as they are classified in the UFO Identified document, were spotted in 34 reports.

One of the most common arguments of UFO and alien sceptics is that sightings are rarely accompanied by actual evidence such as a photograph or a video. Considering that we all have cameras in our pockets, the lack of visual evidence seems quite odd. The UK UFO Report 2022 counts the videos and photos taken by the unidentified aircraft in the sightings reports. According to the data, there were 122 videos and 103 photos taken of the aircraft, as well as 10 sketches of the UFOs. More than half of the reports, however, relied on witness testimony only, which is, of course, much less reliable.

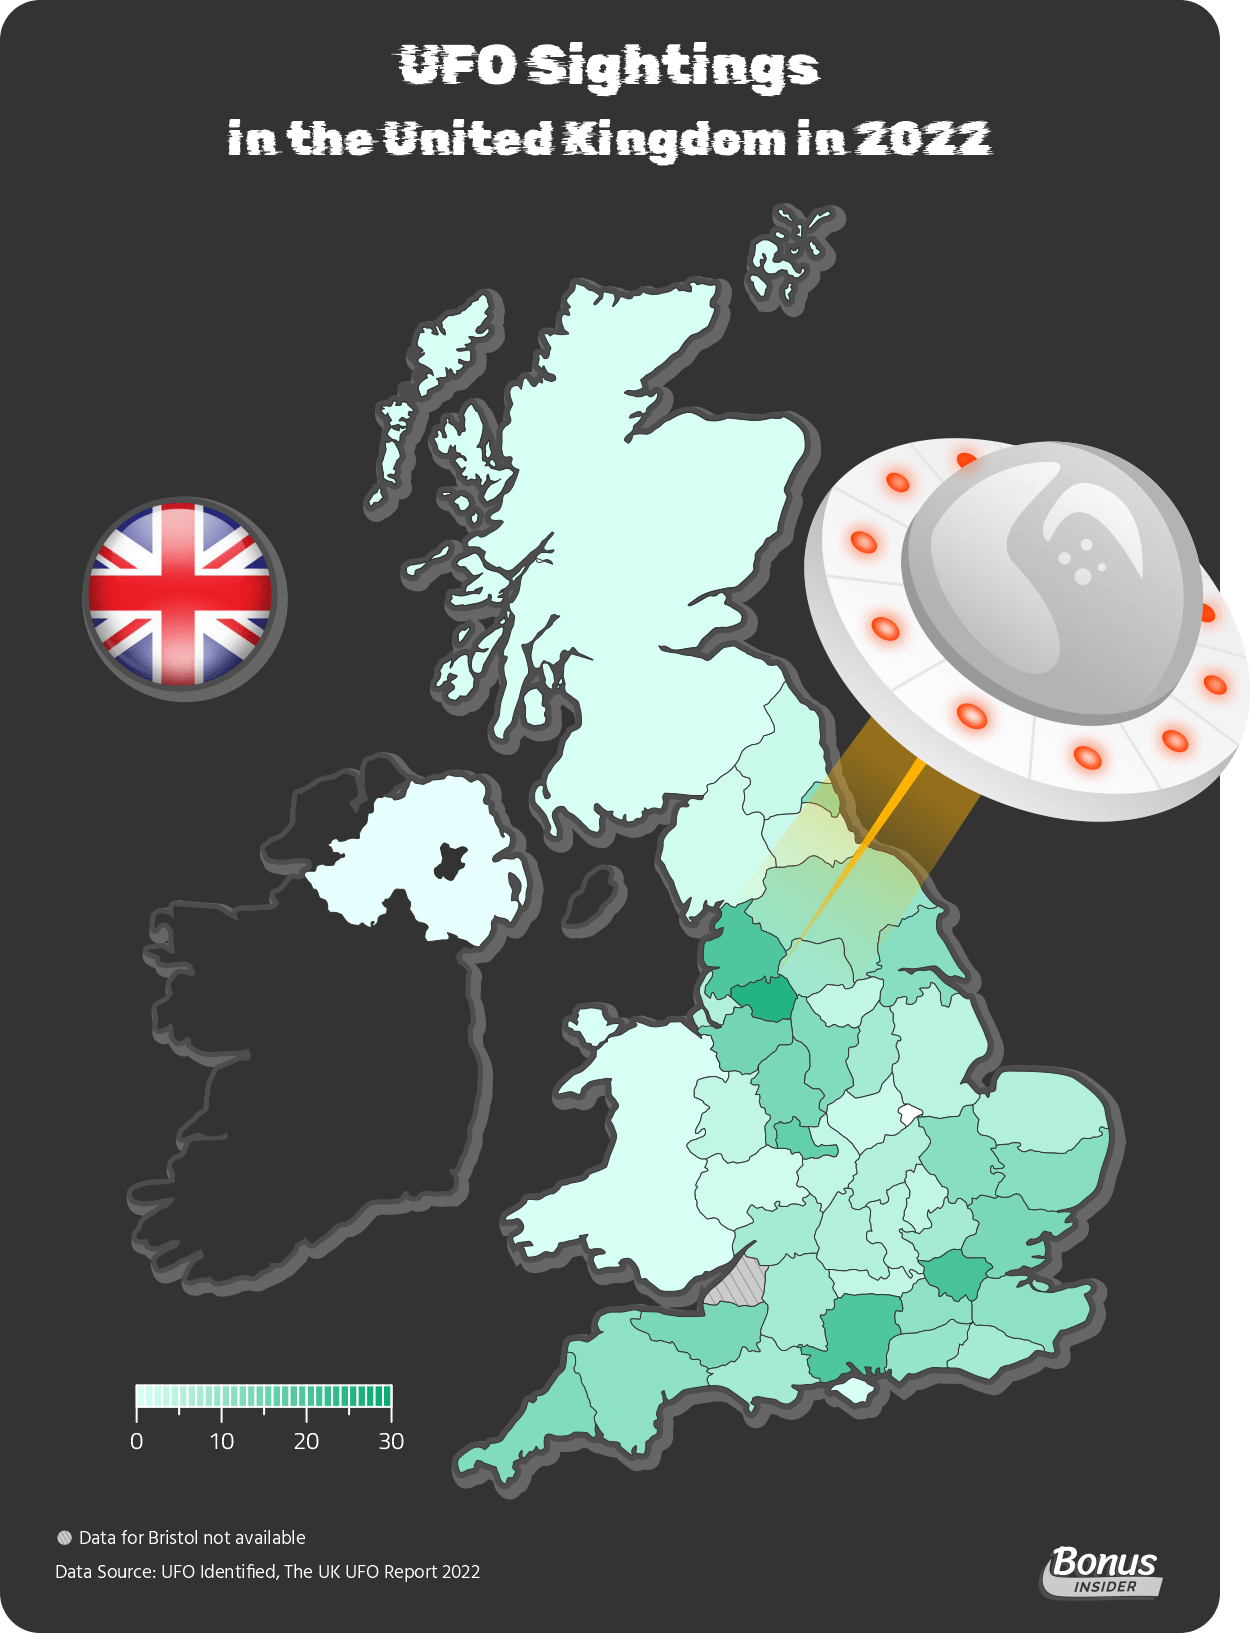
This Is Where You Are Most and Least Likely to See a UFO

Out of all 497 reports, assessed by UFO Identified for 2022, the vast majority were in England – 411 sightings compared to 52 sightings in Scotland, 30 in Wales, and only 4 in Northern Ireland. Localised data is available only for England, so for the map, we calculated the average sightings for the other countries based on 32 council areas in Scotland, 22 counties in Wales, and 11 districts in Northern Ireland.

If we look at the English counties and districts where these unidentified objects were spotted, the areas with the highest population density unsurprisingly had the most reports. There are, of course, a few exceptions.

The highest number of UFO sightings in 2022 were reported in Greater Manchester – a total of 26 reports described either UFOs or UAPs. Greater London ranks second with 20 reports, followed by Lancashire and Hampshire where 19 sightings were reported in each county. Another 17 sightings were reported in the West Midlands, as well as 15 in Cheshire. The counties of Essex, Somerset, and Staffordshire follow with 14 cases each.

It seems Rutland is where you are least likely to spot a UFO, according to the data. Last year, there was not a single sighting there, quite a disappointment for local UFO enthusiasts. The Isle of Wight and Herefordshire had one UFO sighting report each, while people in Worcestershire and across Cumbria saw two objects of possible extraterrestrial nature last year.

Musicians Who Earned the Most in the UK and Ireland in 2022

Musicians are typically known for not having a good handle on the business side of the music they create. There are probably thousands of talented musicians who never achieve great success. Others, however, seem to be natural entrepreneurs according to the list of musicians in the UK and Ireland who earned the most in 2022.

Our team at BonusInsider decided to take a look at the latest data on famous singers and musicians from Britain and Ireland and their estimated net worth. Multiple Grammy award winner Sting earned £100 million in 2022 alone, which makes him the top earner of the year. With a net worth of approximately £320 million, he is among the richest people in the music industry today.

Methodology

For this ranking, we included data from the Sunday Times Rich List 2022. We looked at the twenty richest musicians in the United Kingdom and Ireland, as well as the ten richest young musicians, aged 30 or under.

UK and Ireland: Top 10 Earners in Music in 2022

The music of the British Isles has influenced generations of musicians all over the world and the industry here is among the biggest in terms of talent, album sales, and total revenue. Popular musicians from the UK and Ireland usually enjoy international fame, much like their colleagues from across the pond. If we measure success merely in financial terms, the former frontman of The Police, Sting, was the most successful musician of 2022, increasing his wealth by £100 million in just 12 months. Below are the top 10 earners of the past year:

Sting, £100 Million in 2022

Gordon Matthew Thomas Sumner, also known as Sting, has a total of 17 Grammy awards as a solo artist and as a member of The Police, along with three Brit awards, an Emmy, a Golden Globe, and many others. His accomplishments as a musician are truly impressive, but his financial success over the past year is just as admirable. His fortune in 2022 totals £320 million, up £100 million compared to 2021.

In February, he sold his music catalogue to Universal for an undisclosed amount. Since the deal included both his albums with The Police and as a solo artist, it was probably worth millions. Similar deals were signed recently by other musicians, including Tina Turner, Bruce Springsteen, and Paul Simon. It is believed that Bruce Springsteen sold his catalogue to Sony Music Entertainment for $550 million, while the deal between Bob Dylan and Universal was priced between $300 and $500 million.

Sir Paul McCartney, £45 Million in 2022

One of the world’s most successful composers and performers, Sir Paul McCartney is the richest musician in the UK and Ireland in 2022 with a net worth of £865 million. From his years with the Beatles to his hits with the band Wings and later his solo career, McCartney has written or co-written a record 32 songs that have topped the Billboard Hot 100.

This year, he had a successful US tour that kicked off in April and ran until June. After the “Got Back” tour concluded, he headlined Glastonbury Festival, a week after his 80th birthday. Over the past year, the former Beatle earned approximately £45 million, which makes him the second-biggest earner in the UK and Ireland for 2022.

Ed Sheeran, £40 Million in 2022

Born in 1991, Ed Sheeran is the youngest artist on this list, and in 2022, he made an estimated £40 million. Sheeran rose to fame in 2011 when his debut album “+” topped the UK Albums Chart, and since then, he has earned multiple awards and sold more than 150 million records worldwide. With his acoustic-based songs and down-to-earth approach to pop music, he has had an impact on an entire generation of musicians. Currently, his wealth stands at £260 million and he is the 10th richest musician in 2022.

Harry Styles, £25 Million in 2022

Harry Styles, whose career began in 2010 with his participation in The X Factor and later as a member of the successful boy band One Direction, is now the richest young musician (aged 30 and under) in the UK. The 28-year-old Styles has a net worth of £100 million, an increase of £25 million from 2021.

The past year has been incredibly lucrative for the English singer. His third album, “Harry’s House”, was released in April, achieving commercial and critical success around the world. During his Love On Tour, he performed 15 sold-out shows at Madison Square Garden. In addition, Styles starred alongside Florence Pugh in Don’t Worry Darling, the Olivia Wild-directed psychological thriller that was released in 2022. A less famous film with him in the lead, My Policeman, also premiered in 2022.

Dua Lipa, £24 Million in 2022

Dua Lipa started her singing career in 2014 and quickly became one of UK’s favourite pop stars. Born in London, she does not hide her origin – both her parents are Albanians from Kosovo, who immigrated to the UK in the early 1990s. In 2022, she embarked on the Future Nostalgia Tour in support of her second album, which came out in 2020. The tour was postponed due to the COVID-19 pandemic but this year, it was the biggest concert tour so far for the artist, with shows all over the world.

Sir Elton John, £20 Million in 2022

With a career spanning over 6 decades, Sir Elton John is among the most famous and esteemed musicians from the UK. He has a huge collection of awards and accolades and since 1969, he has released 31 albums and sold a total of 300 million records worldwide. Apart from being the fourth-best-selling artist of all time (after The Beatles, Elvis Presley, and Michael Jackson), The Rocket Man is also among the biggest earners of 2022. His estimated wealth has increased by £20 million to £385 million as his farewell tour, which was announced in 2018, still continues and includes dates for 2023.

Mick Jagger and Keith Richards, £8 Million Each in 2022

The songwriting partnership between the Rolling Stones co-founders Sir Michael Philip Jagger and Keith Richards has been one of the most successful in history. They have been friends for 70 years and colleagues for 60, although their relationship has not always been described as a particularly friendly one, so it should come as no surprise that we are listing them together in this ranking.

Each earned £8 million over the past year, becoming some of the biggest earners in 2022. With an estimated fortune of £318 million, Mick Jagger is the sixth richest musician in the UK and Ireland. Coming in just behind him is Richards, whose wealth is estimated to be around £303 million.

Brian May and Roger Taylor, £8 Million Each in 2022

As the only two active members of Queen, Brain May and Roger Taylor are amongst the most respected musicians in the UK. Following the death of Freddy Mercury, they have not stopped touring, and have even collaborated with Paul Rogers (formerly of Bad Company, Free) and American singer Adam Lambert. Within the past year alone, May and Taylor increased their wealth by £8 million each to £218 million and £198 million, respectively.

Richest Musicians in the UK and Ireland in 2022 Ranked by the Wealth They Earned over the Past Year
Musician Wealth in 2022 Change from 2021
Sting £320M £100M
Sir Paul McCartney* £865M £45M
Ed Sheeran £260M £40M
Harry Styles £100M £25M
Dua Lipa £60M £24M
Sir Elton John £395M £20M
Sir Mick Jagger £318M £8M
Keith Richards £303M £8M
Brian May £218M £8M
Roger Taylor £198M £8M
Little Mix £60M £6M
U2 £625M £5M
Olivia and Dhani Harrison £295M £5M
Sir Ringo Starr £285M £5M
Sir Tom Jones £180M £5M
Louis Tomlinson £48M £3M
Stormzy £26M £2M
Lewis Capaldi £19M £2M
Sam Smith £34M £1M
Calvin Harris £220M No change
Sir Rod Stewart £215M No change
Roger Waters £210M No change
Michael Flatley £206M No change
Eric Clapton £195M No change
Robbie Williams £195M No change
Charlie Watts’ family (The Rolling Stones) £175M No change
Niall Horan £52M No change
Liam Payne £44M No change
Zayn Malik £36M No change
Lord Lloyd-Webber £495M -£30M

As we can see from the ranking above, the past year has been a very lucrative one for musicians in the UK and Ireland. Out of all artists listed here, only one saw his wealth shrink over the past year. This is composer and theatre owner Lord Andrew Lloyd-Webber, who apparently lost roughly £30 million as a result of the pandemic, which affected the theatre industry over the past two years. Still, Lord Lloyd-Webber remains one of the richest people in music with an estimated fortune of £495 million.

The 10 Most Popular YouTube Channels As Of January 2023 And The Revenue They Have Generated Till Now

YouTube has become a lucrative source of revenue for creators on the platform. Initially launched to share videos such as tutorials and blogs, the site saw rapid growth in just one year, reaching 65,000 uploads and 100 million views per day.

Now, with 2.5Bn monthly users, the platform has paved the way for creators to generate a large following and, even more significantly, a source of revenue. YouTube’s partner programme allows creators to make money from adverts shown in their videos. In Q3 of 2022 alone, YouTube ad revenue was over $7Bn. Once creators have gained a large enough following, the doors are open to several avenues of income.

For some creators, YouTube ad revenue is their primary source of income, as their large subscriber count allows them to sign brand deals and promotional partnerships. Therefore, it is easy to see why many creators upload to their platform daily, in order to reap the benefits of having a large number of followers on their channel.

Currently, the YouTube channel with the highest number of subscribers is the Indian music network T-Series, with 229 Million. This led BonusInsider to search for the top 10 most subscribed YouTube channels and to investigate how much revenue they have generated since the start. All the data in this article is current as of November 2022.

Methodology

The revenue calculated in this article is based on the CPM and CPC. CPM (Cost Per Mille) is the revenue calculated per every 1,000 views of a YouTube video. CPC (Cost per Click) is how much the advertiser pays for every click on the ad. We combined the two sources to reach an estimated gross revenue for each YouTube channel.

The average CPM is $7.60. We used the influencer marketing hubs YouTube money calculator to calculate the revenue for each channel. Google takes a 45% share of YouTube advertising revenue. This leaves the content creator with 55% of each dollar advertisers pay, or an average of $4.18 for every 1,000 views.

We used the top 10 most subscribed channels, including only creators on the platforms. We have excluded YouTube Movies (158M Subscribers), YouTube Music (117M Subscribers), and YouTube Gaming (93.1M Subscribers) as YouTube itself runs them. The revenue generated from these channels is unavailable, as they are managed directly by YouTube.

It should be emphasized that these are estimates for the total gross revenue of each of the top 10 creators, which in turn depends on the ads the creator chooses to run on their videos. For example, video ads (which play at the start of the video) are more profitable than banner ads (which appear at the bottom of the screen during the video playtime). This must be taken into consideration when looking at the data. Additionally, not every video the creators ever made will have been monetized. It is important to bear this in mind when looking at the data.

10 Most Popular Youtube Channels

1. T-Series- 233 Million Subscribers. Total Overall Views: 207Bn Total revenue: $408M

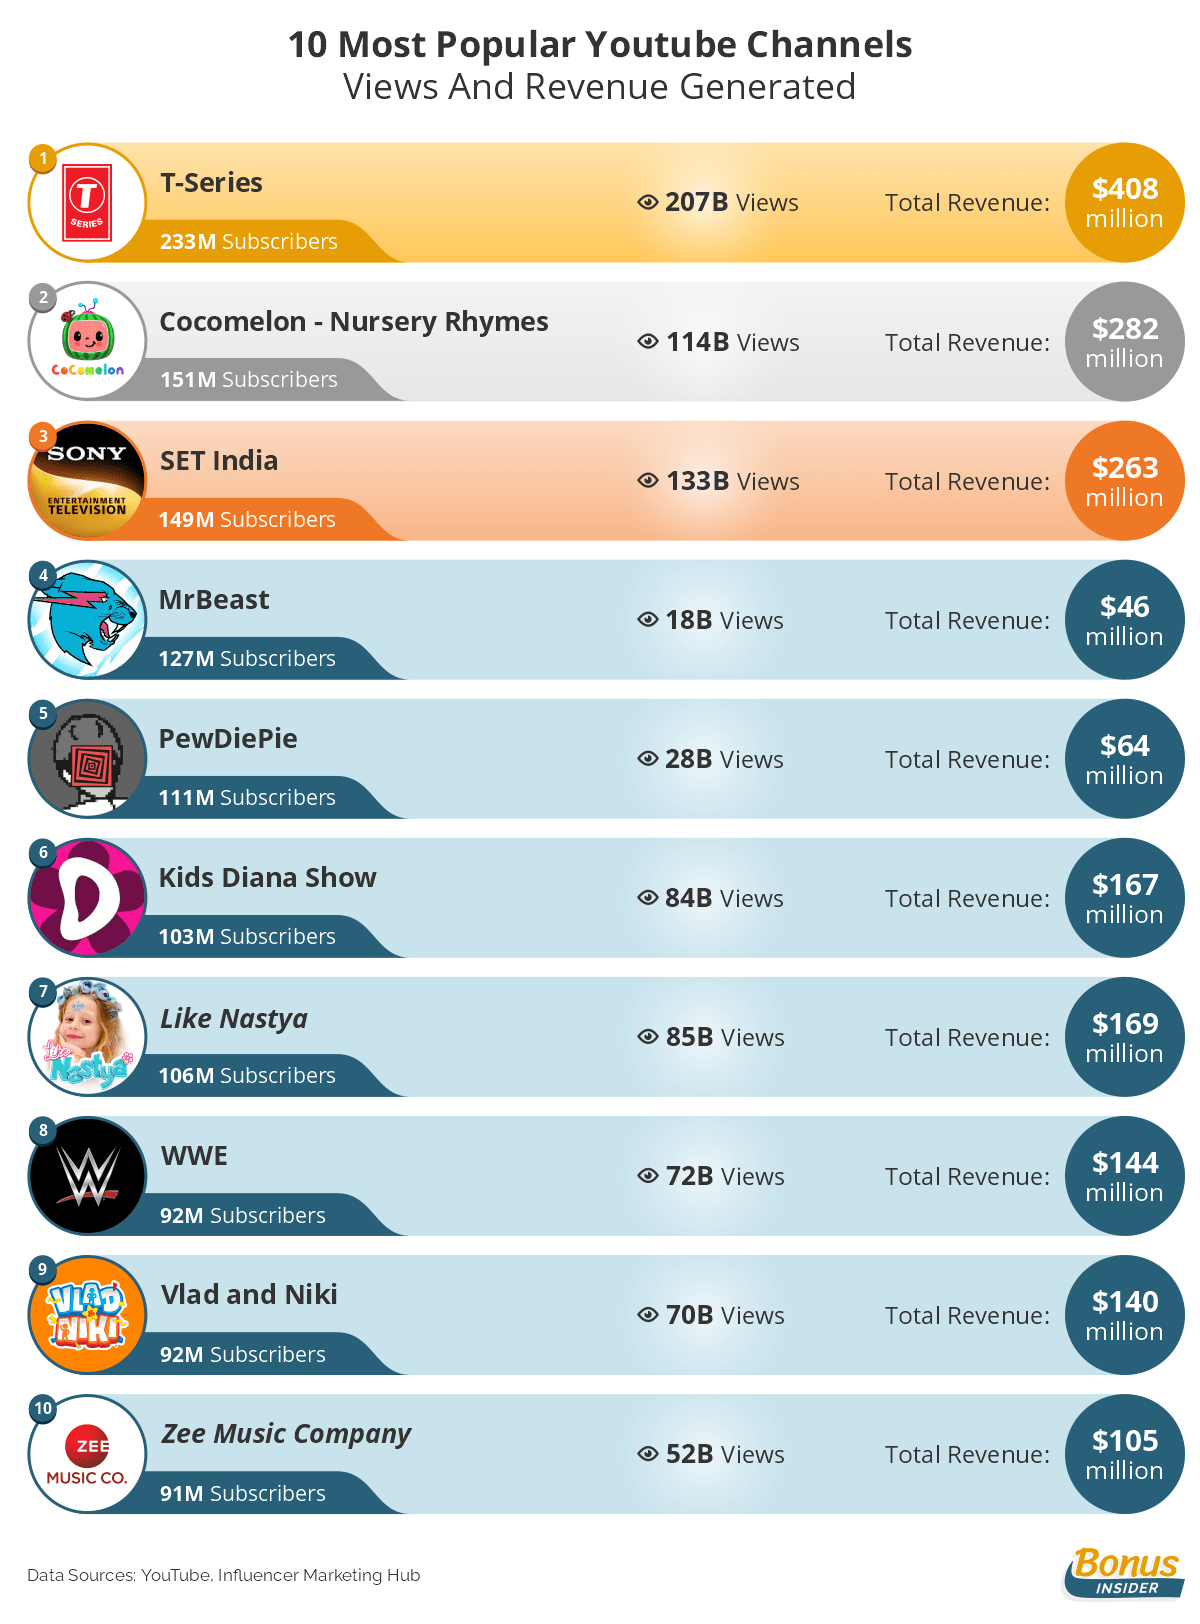
T-Series is an Indian music label and film production company that started to leverage YouTube in 2010. With over 207Bn total views across all its videos, T-Series sits firmly as the most subscribed YouTube channel in the world. It was the first YouTube channel to surpass 100 million subscribers in 2019. The channel is renowned for its excellently executed music videos and film trailers.

2. Cocomelon- Nursery Rhymes- 151 Million Subscribers. Total Overall Views: 114Bn Total Revenue: $282M

Created in 2006, the children’s educational channel Cocomelon provides videos surrounding nursery rhymes. First known as Checkmate, it rebranded itself in 2018 to Cocomelon and changed the logo to a watermelon-style TV. Now the channel has Spanish, Portuguese, Mandarin Chinese, German and Arabic content. Total views are over 114Bn.

3. SET India- 149 Million Subscribers. Total Overall Views: 133Bn Total revenue: $263M

Sony Entertainment Television has over 133Bn views across all of its videos. It consists mainly of videos highlighting moments from the Hindi Sony Entertainment Television shows and films. The TV show provides family entertainment, which has translated nicely onto YouTube as viewers can capture snippets of popular shows.

4. MrBeast- 127 Million Subscribers. Total Overall Views: 18Bn Total revenue: $46M

MrBeast, also known as Jimmy Donaldson, is a 24-year-old American YouTuber who makes iconic stunt videos. MrBeast is the most subscribed individual on the platform and began posting in 2012, at just 13 years old. With a team of 30 now running the channel, he is currently the highest-earning creator on the platform. His videos have accumulated over 18Bn views on his main channel.

5. PewDiePie- 111 Million Subscribers.Total Overall Views: 28Bn Total revenue: $64M

Once the most subscribed channel on YouTube, PewDiePie was one of the fastest growing channels between 2010 and 2013. Also known as Felix Arvid Ulf Kjellberg, PewDiePie is best known for his let’s play videos. He was overtaken in 2019 by T-Series. However, PewDiePie is still one of the most subscribed YouTube channels in the world, with total views in excess of 28Bn.

6. Kids Diana Show- Total Overall Views: 84Bn 103 million. Total revenue: $167M

Eva Diana Kidisyuk is the face of the Kids Diana Show. The young star was born in 2014 in Ukraine and hosts roleplay-orientated content on her channel. She is popular among children for her educational and entertaining lifestyle videos. The channel has accumulated over 84Bn views in its lifetime.

7. Like Nastya – 106 Million Subscribers. Total Overall Views: 85Bn Total revenue: $169M

One of the youngest creators in the top 10 most subscribed YouTube channels is Anastasia Sergeyevna, also known as Like Nastya. The Russian/ American YouTuber and her parents host children’s stories and roleplays. Anastasia has been diagnosed with cerebral palsy and is seen as an idol by many young viewers worldwide. The channel’s videos combined have over 85Bn views.

8. WWE- 92 Million Subscribers.Total Overall Views: 72bn Total revenue: $144M

The World Wrestling Entertainment (WWE) channel is the world’s largest professional wrestling channel. Its videos showcase iconic matches and significant moments in WWE history. Filled with adrenaline and smackdowns, it is easy to see how the channel has reached over 72Bn views.

9. Vlad and Niki- 92 Million Subscribers- Total Overall Views: 70Bn Total Revenue: $140M

The joint No 9 is Vlad and Niki, two Russian brothers now residing in Miami. They grew in popularity in 2018, when their father quit his job due to the channel’s success. They now run 21 YouTube channels with roleplay and vlog-style videos, with Vlad and Niki being their most successful one.

10. Zee Music Company- 91 Million Subscribers. Total Overall Views: 52Bn Total Revenue:$105M

Zee music company has a major chunk of the Bollywood music market. The channel videos feature vibrant Bollywood music videos by some of the biggest names in the industry. The estimated revenue of the channel is $105M and it is set to keep growing.

Conclusion

It is clear that every channel on the list has a different niche and target audience – predominantly Asian TV, children’s channels, and let’s play videos. This highlights the fact that specific types of content are in significant demand on the platform, leading to the rapid growth of certain channels. The YouTube partnership program, combined with the growing phenomenon of the ‘YouTube Celebrity”, has carved out a lucrative career path for many creators. Additionally, YouTube channels run by large businesses have higher revenue than those run by individuals. Overall, the top 10 most subscribed channels’ combined revenue currently stands at almost $1.8Bn.

Survey Reveals the Most Addictive PlayStation 5 Games According to Players

Ever since video games became widely popular in the 1980s, certain titles have been much more entertaining and addictive than others. The multiplayer online games of the past two decades especially, have exploded in popularity, with thousands of gamers playing on the same server. As for PlayStation 5, one of the most preferred gaming consoles in the world right now, there are a wide variety of high-quality titles that keep players hooked for hours at a time.

In order to draw players and keep them coming back again and again, it is not enough for games to have extraordinary graphics or memorable stories. The high level of challenge, intuitive controls, and the relative freedom to explore the in-game world beyond the main storyline is what makes these titles replayable and truly addictive. To determine which PlayStation 5 games fit this description best, the team at BonusInsider asked gamers about the games they spent the most hours playing.

Methodology

The survey was conducted in early December among 1,633 self-reported online users aged 18 or over. They were given a seed list of games that featured the 20 most played PS5 games for the month of November, according to the independent PS analysis website PS-Timetracker. Players had to pick the one game they tended to play most often, and specify the number of hours they spent on this game each week.

Most of the titles they picked were, unsurprisingly, MMO (massively multiplayer online) and MMORPG (massively multiplayer online role-playing) games – fast-paced, action-packed, and bringing that rush of adrenaline players want from a video game. We also asked survey participants about the length of their average play session in order to see whether they were truly addicted or were simply passionate gamers.

The Most Addictive Games for PlayStation 5

The following list features 10 titles which were selected by players as the most compelling and addictive games. Note that these are not the best-selling or most popular video games by player count. Among the biggest titles that did not make the cut are Grand Theft Auto V, God of War, Rocket League, Minecraft, Dead by Daylight, Tom Clancy’s Rainbow Six Siege, Elden Ring, Genshin Impact, Cyberpunk 2077, and Gran Turismo 7.

It should be noted that the hours played per week cited here are how much gamers tend to play on average every week. Some participants might play a game for 10 hours straight, while others might prefer shorter sessions of 2 or 3 hours at a time, four or five times a week.

Rust Console Edition, 13.6 Hours per Week

This survival multiplayer-only game was initially launched in 2013 by Facepunch Studios but did not receive a full release until 2018. Last year, after becoming hugely popular on Twitch, it also became available for consoles and is now considered one of the best survival games. Its premise is quite simple – players need to survive in a dangerous apocalyptic, open-world environment where they are constantly being attacked by other players and wild animals. They also need to gather resources, craft weapons and other gear, and stay fed in order not to perish.

ARK: Survival Evolved, 12.3 Hours per Week

ARK: Survival Evolved is an MMORPG survival game by Studio Wildcard, which was released in 2017. It is available in both single and multiplayer modes. The open-world environment is full of prehistoric animals and monsters, and players need to guarantee their survival by gathering resources, fighting other players, and building a base. The game’s most addictive features – the grinding and the nearly unprecedented difficulty – are also among its most critisized. Still, gamers in the poll tended to spend an average of 12.3 hours playing this action-packed game.

Call of Duty: Modern Warfare 2, 11.7 Hours per Week

COD Modern Warfare 2 is the sixth installment in the Call of Duty franchise and first became available in 2009. Although Activision has released newer editions since then, Modern Warfare remains among the most popular first-person shooter games in the world. It is short, fast-paced, and universally loved by gamers for its gunfights. With an average of 11.4 hours of play per week, it is also one of the most addictive games for PS5 according to survey participants.

NBA 2K23, 11.4 Hours per Week

Based on the National Basketball Association, NBA 2K23 is the 24th game in the franchise and was released in September 2022. This is currently one of the most played sports video games. Offering both single and multiplayer mode, it has the potential for being replayed multiple times without being too repetitive. Gamers in our poll said they play it 10.8 hours per week on average, which is also probably due to the fact that it is still new.

God of War Ragnarök, 10.8 Hours per Week

The 8th installment in the God of War series, Ragnarök is a third-person action-adventure video game that saw its worldwide release on November 9, 2022. It was an instant success for its publisher Sony Interactive Entertainment (the company behind PlayStation), selling 5.1 million units in its first week. It was nominated for Game of the Year at The Game Awards 2022 and is currently among the most played titles on PS5 with 10.5 hours of play per person per week on average, according to our survey.

EA SPORTS FIFA 23, 10.1 Hours per Week

FIFA 23 is the 30th, most recent edition of the popular franchise by Electronic Arts, which was released in September 2022. The football simulation game includes modes based on the 2022 FIFA World Cup and the 2023 FIFA Women’s World Cup. One of its most appealing features is the cross-play between users of same-generation consoles. Currently, this is one of the most played games on PS5 as gamers in the survey spend 10.1 hours per week on average on it.

Destiny 2, 9.6 Hours per Week

Destiny 2 is a first-person shooter game by Bungie and has been one of the most popular MMOG titles since its release in 2017. Later, it was made available as a free-to-play game, and in December 2020, it was released for PlayStation 5 and Xbox Series X/S. It features elements of RPG and can be played in both PvE (player vs environment) or PvP (player vs player). It also has quests, strikes and raids by clans, and the traditional deathmatch. All this makes the game extremely varied and exciting, compelling gamers to replay it multiple times. The second installment of Destiny was played 9.6 hours per week on average by gamers in the survey.

Overwatch 2, 9.5 Hours per Week

This is a new first-person shooter from Blizzard Entertainment which serves as the sequel to the 2016 original. Released through early access in October 2022, it offers full cross-platform play and features PvP, as well as persistent cooperative modes. It is played as a hero shooter and has PvE mode as well, which was introduced as part of the story, making the game even more entertaining and compelling. Since it is still quite new, Overwatch 2 is among the most popular games for PS5 right now and is played for 9.5 hours per week on average, according to the survey results.

Fortnite, 8.9 Hours per Week

Since its release in 2017, Fortnite has become one of the most popular video games in the world and is now available for all systems, including PS5. It offers three distinctive game modes – a battle royale, cooperative survival and a sandbox game, in which players have the freedom to create their own battle arenas. Over the years, it has both been nominated for and won awards multiple times, and continues to attract players. Survey participants played this game for 8.9 hours per week on average.

Apex Legends, 8.5 Hours per Week

Originally released in 2019, this free-to-play battle royale-hero shooter game became available for PS5 in March 2022, offering full cross-platform play. The exception is for mobile platforms, where a separate version of the game exists. Within a month after its release, Apex Legends already had 50 million players, and later attracted another 50 million, making it one of the most played video games in history by player count. It was also selected as one of the most addictive titles in our survey, with gamers spending an average of 8.5 hours per week playing it.

How Long Is Your Typical Playing Session?

The vast majority of gamers are passionate about their favorite video games but can hardly be described as gaming addicts. Out of all 1,633 players, only 2.3% said their average session lasted more than 10 hours. Practically none of them spent less than an hour on the PlayStation, while 24.9% played between 1 and 2 hours at a time. The majority of gamers (52.5%) played 2 to 4 hours, and 10.5% played between 4 and 6 hours. Around 6.9% spent 6 to 8 hours playing, while 3% admit to even longer game sessions of up to 10 hours.

Data Reveals 304.7M Online Accounts Breached in 2022

With an estimated 5.3 billion people using the Internet at the beginning of 2023, digital security is becoming critical for private users, businesses, and governments. Yet, many people still use a single email and even worse, a single password for multiple accounts, making them extremely vulnerable to cyber attacks. The month of October was Cybersecurity Month all over Europe and the US, where cybersecurity firms organized various events to raise awareness of the issue. November 30 marked International Cybersecurity Day, which is recognized worldwide.

To bring awareness of the risks associated with Internet usage, the team at BonusInsider decided to look at the latest statistics about data breaches from Surfshark and discovered that in 2022, there were over 304.68 million data breaches around the world. While this figure seems massive, the number of breaches actually fell dramatically from 2021 and from 2020 when stats show three and four times as many attacks. Since 2004, the cybersecurity company has identified an astounding 15.5 billion data breaches.

Passwords Are the Most Commonly Leaked Piece of Information

It’s difficult to imagine a service or a product that is not available online and websites, apps, and social media platforms are now a massive part of our lives. This means that people have their emails, passwords, names, and addresses on the Internet, not to mention banking and credit card information, social security or national security numbers, etc. All this sensitive data is shared with private companies, and financial and government institutions. And most of it is protected by a password, or so we believe.

It turns out that of all pieces of information about a user – such as username, password, IP, last name, etc., the passwords are the most commonly breached data points. Since 2004, more than 15.5 billion accounts have been breached and 51.8 billion data points have been exposed. Of those, 15.5 billion have been email addresses and on average, each email address is leaked with 2.3 additional data points. It is estimated that for every 100 breached accounts, 88 passwords have been exposed.

Russia and the US Have the Most Data Breaches Per Capita

Looking at the number of exposed online accounts and individual data points, they seem astronomical. To put them into perspective, let’s compare them to the number of people living in a particular country. Globally, 198 accounts and 69 unique accounts are breached per 100 people on average. Of the 15.5 billion breached accounts since 2004, 5.4 billion have had unique email addresses. So, statistically, every single email address has been exposed 3 times.

Russian accounts, however, are much more likely to be exposed – the country has the highest number of breached accounts per 100 inhabitants, 1,544, which is 7.8 times more than the global average. Moreover, every Russian email has been breached roughly 15 times. The United States comes second with 743 breaches per 100 residents, followed by France (651 per 100 people), South Sudan (601 per 100 people), and the Czech Republic (558 per 100 people).

Record-High Breaches per Capita in the Cocos Islands and the Vatican

The ranking shown above includes only countries with a population of 1 million or more. One curious fact about the data set is if we consider all 250 countries and territories included in it, those with the most exposed accounts are tiny nations and remote islands. For instance, the Cocos Islands, which had a population of 593 people in 2020, also have 2.7 million breached accounts per 100 residents.

The French Southern Territories, Niue, Tuvalu, and Tokelau are in the same absurd situation, which could be explained by the specific methodology used to record the data breaches. Along with user data such as email domain, IP, country, city, and exact coordinates, many of the recorded cases include the breached website domain. Tiny nations, provinces, and dependencies often lack adequate regulation, making them the perfect destination for registering domains for hosting phishing sites.

Such sites resemble the original sites of banks, web stores, and even government institutions, and links to them are usually included in phishing emails. Once online users click on the link, they get to the fake login page, which looks identical to the page of their bank, for instance, but rather than having a .com, .uk, .eu, etc., domain, these fake websites end in .cc (Cocos Islands), .tv (Tuvalu), or .tk (Tokelau). This is probably how these small countries ended up with the most data breaches per capita.

The country code top-level domain (TLD) of the Vatican City, on the other hand, is .va and it is administered by the Internet Office of the Holy See, so you cannot register a site with this extension so easily. Due to the many restrictions, it is interesting how the Vatican has ended up with more than 78,000 breaches. Since officially, it has a population of only 801, these cases are 9,746 data breaches for every 100 residents.

Countries Affected by the Most Data Breaches in 2022

In 2022, 304,684,279 accounts have been breached around the world and roughly 114 million of these breaches occurred in the third quarter of the year. In comparison, there were approximately 82 million breaches within the first three months of 2022 and another 65 million in the second quarter. Only 43 million cases were identified between October and December, down 62% from Q3.
The countries affected the most in 2022 were Russia (103.5 million breaches), China (33.9 million), the United States (22.4 million), France (19.8 million), and Indonesia (14.7 million).

There are not many surprises in the list above since these are among the most populous countries in the world. There was a sharp decline in the number of data breaches in the last three months of the year but not for all countries. Interestingly, the cases jumped dramatically in Turkey – from a little over 133,700 in Q3 to more than 2 million breaches in Q4, which was an increase of 1,427%. North Korean accounts were also much more heavily attacked in the fourth quarter than in the rest of the year. The number of breaches rose 603% to 4,450 compared to only 633 cases in Q3.

Over a Third of All Exposed Accounts Are in the US, Russia, and China

The largest and most populous countries in the world have been targeted the most by cybercrime, at least in terms of pure numbers. The United States is the country with the most data breaches – 2.46 billion since 2004, followed by Russia with 2.24 billion exposed accounts, and China with 1.02 billion breaches. These make up 37 percent of all cases in the world.

The other nations with a huge amount of exposed accounts are Germany (450 million), France (425 million), India (264 million), the United Kingdom (257 million), Brazil (263 million), Italy (248 million), and Canada (187 million). In fact, the breaches in these 10 most affected countries account for just over half of all cases (50.5%), while the incidents in the rest of the world make up 49.5 percent.

Methodology

The statistics about data breaches are published every month by Surfshark and they track the reported breaches around the world since 2004. They are based on thousands of leaked databases available online and include all cases where a hacker or intruder copied and leaked user data such as names, surnames, email addresses, passwords, etc. To compare the number of breached online accounts to a country’s population, BonusInsider used population figures by Wordometers. They are based on the latest United Nations Population Division estimates for 2020.

How the world would have looked in 2022, according to science fiction

Considering technological developments such as smartphones, mapping, GPS, gaming consoles and social media, beliefs from over 100 years ago that technology would take over every aspect of life in the 21st century were pretty spot on. At times, science fiction writers have been almost clairvoyant in their vision of the future. On other occasions, however, they seem to have put more (or significantly less) faith in the potential of humanity than we deserve.

We found several science fiction movies from the past few decades that describe what the world would look like in 2022. As we are now living in what they perceived as the future, some of their predictions seem quite absurd and ridiculous. Others, however, seem to come very close to the current state of affairs – closer than we could ever have imagined. The team at BonusInsider decided to explore these predictions to see if they have come true – and in short, some of them definitely have.

Soylent Green (1973)

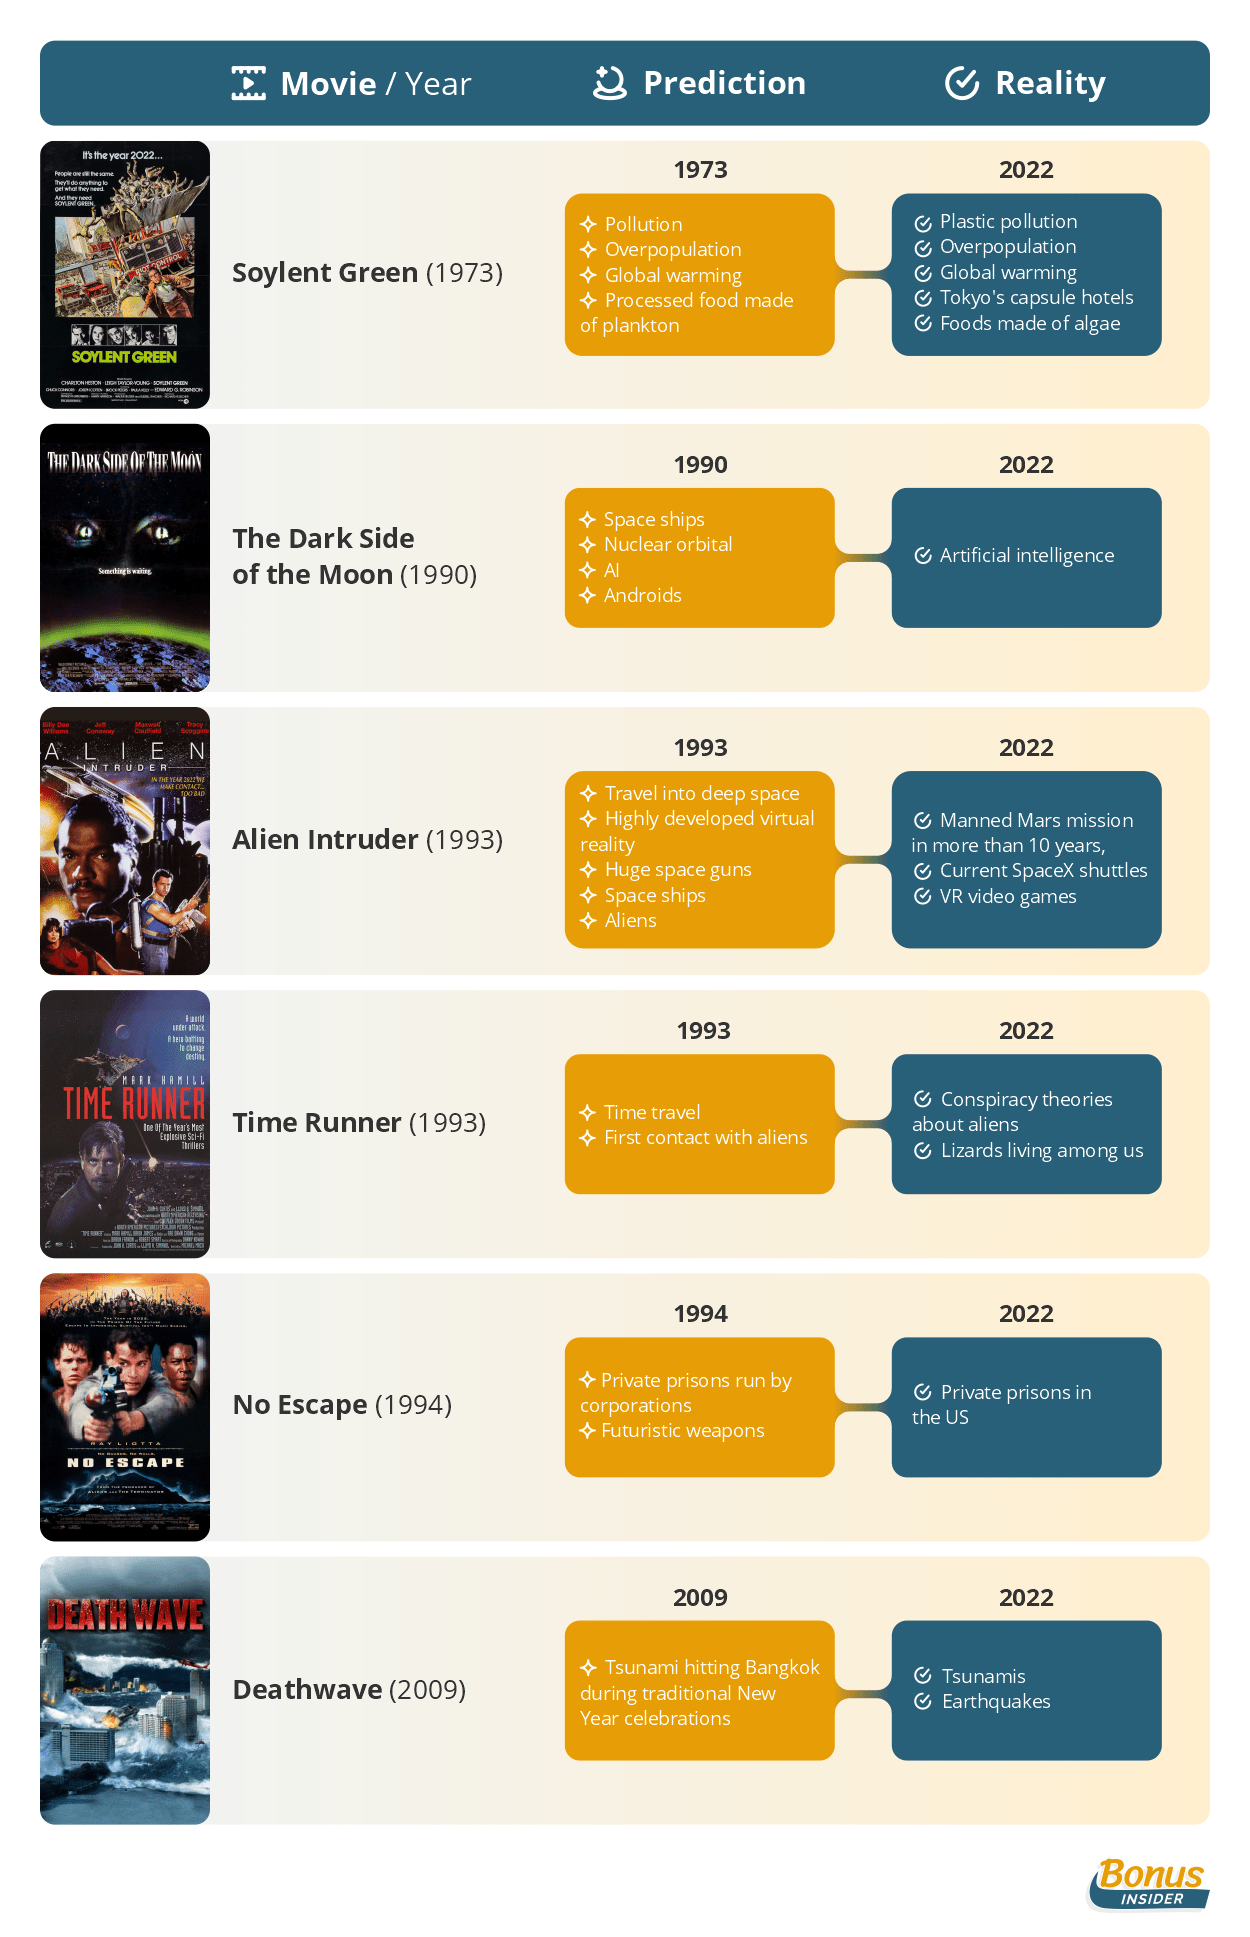
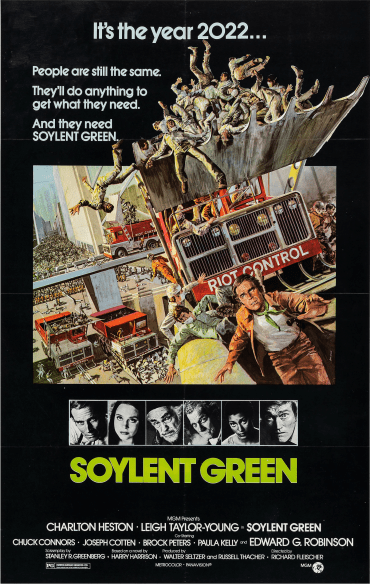
Starring Charlton Heston as police detective Robert Thorn, Soylent Green is a dystopian thriller set in New York of 2022. As 40 million people live in a polluted and overpopulated city, only the elite can afford spacious homes and real food. Global warming has caused a worldwide shortage of food and water, forcing common people to survive on highly processed wafers called Soylent Red, Soylent Yellow, and Soylent Green. While investigating the death of a board member of the Soylent Corporation, detective Thorn uncovers a horrible secret about the otherwise nutritious Soylent Green, which is supposed to be made of plankton. The truth makes the movie much darker than it seems initially.

Ecological and environmental issues are certainly real in 2022, although not nearly as serious. Various alternative foods have been proposed as a way to feed the growing global population, including lab-grown meat, algae, insects and so forth. The movie has also inspired a real-life wafer-like food called Soylent.

Alien Intruder (1993)

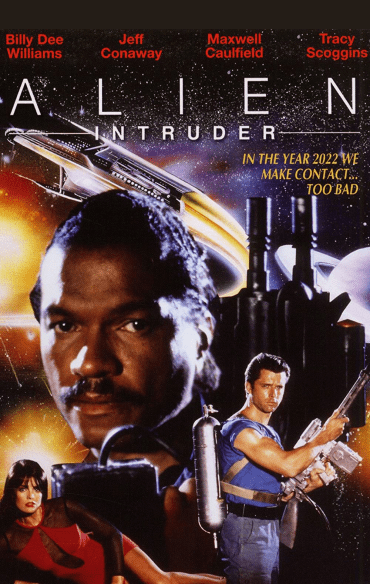
A group of convicts sentenced to life in prison are sent on a rescue mission in deep space in this action/sci-fi and mild horror film from 1993. While on the way to the lost ship, they’re about to salvage four men who have been allowed to spend time in a virtual reality world. A mystery woman appears in VR, making the men turn on each other – in fact, she is an alien whose DNA has been turned into a biochemical virus inside the ship’s computer system.

Traveling into deep space is currently not feasible, although NASA is planning a manned Mars mission to be carried out by the late 2030s. Although VR does exist, it is still very limited – in particular, there are certain graphical limits and limits of movement.

The Dark Side of the Moon (1990)

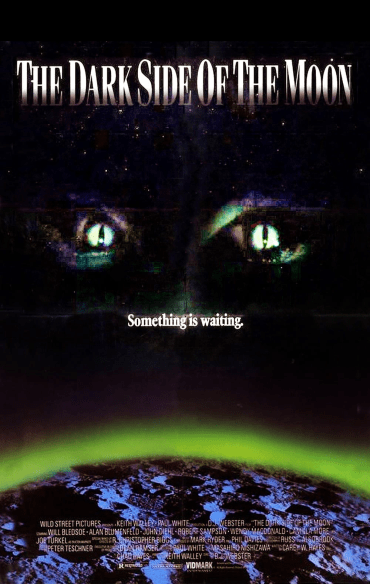
The Dark Side of the Moon is a science fiction horror film that was released on VHS in 1990. Its quite preposterous plot is probably one of the reasons for its generally low ratings online – 22% on Rotten Tomatoes and 4.9/10 on IMDb. A crew of a repair ship is sent to fix a nuclear orbital weapon, but after their ship malfunctions, they start drifting toward the dark side of the Moon. They see NASA’s old space shuttle Discovery and board it, trying to salvage parts for their ship, but an evil force is waiting for them. It turns out that the area they are in corresponds to the Bermuda Triangle, while the evil that attacks them is the Devil himself.

This vision of 2022 is quite absurd, considering the film was conceived barely three decades ago. It portrays highly developed AI, androids, spaceships, and, of course, nuclear orbital weapons, none of which exist in the same form today. However, orbital weapons have been researched and AI is constantly improving.

Time Runner (1993)

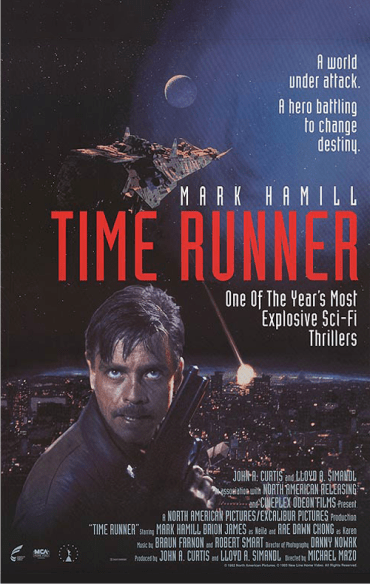
Aliens attack the Earth on October 6, 2022 in the 1993 film Time Runner. Captain Michael Raynor (Mark Hamill) is on a military space station and manages to escape before the aliens destroy the station. After a wormhole opens, he is sent 30 years into the past, where he discovers that the alien race was on our planet long before the invasion. The aliens look just like humans and act as sleeper agents with the mission to enable a future attack.

The movie couldn’t really make an accurate prediction, but it did show a conspiracy theory which is more popular now than ever – that many influential people are aliens, lizards, etc. Time travel is still out of reach, and a first contact with an alien race has not been made yet.

Deathwave (2009)

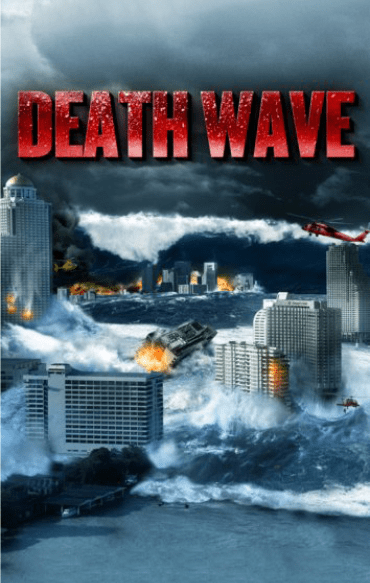
Deathwave is a disaster movie from Thailand whose aim is to warn us about tsunamis, earthquakes and other natural disasters that may change the world as we know it. It follows the young prime minister of Thailand, who tries to prevent such a scenario after the devastating 2004 tsunami. He orders the creation of a national disaster alarm center, but despite his efforts, a huge tsunami hits Bangkok on Songkran Day, the traditional New Year in Thailand.

Thailand is close to the so-called Ring of Fire, a region around the Pacific Ocean with many earthquakes and volcanic eruptions. In 2004, following a massive earthquake, Thailand, along with several other countries, was hit by the deadliest tsunami in recorded history. The movie offers no futuristic vision – instead, it depicts a possible near future based on events that happened less than 20 years ago. It simply warns us that it is impossible to predict natural disasters, and that unfortunately, it is just as impossible to prevent them.

Survey Finds Most Online Shoppers Willing to Spend More Than They Planned on Black Friday If They Find Good Deals

Shoppers worldwide are looking forward to the end of this week, when heavy discounts on clothes, electronics, toys, and other goods are set to make Christmas shopping a little more affordable. Due to the high inflation, however, prices may not seem as attractive as last year.

Still, millions take part in the Black Friday frenzy, and most shoppers are willing to spend more than they had planned if they find good deals. According to a survey conducted by BonusInsider, around 60 percent of online shoppers are willing to overspend, should they get a good discount.

Known as the unofficial start of the holiday shopping season, Black Friday attracts millions to brick-and-mortar and online stores, but the higher cost of living may take its toll on shoppers’ pockets and, as a result, on retailers’ revenues this year. Considering the high inflation rates over the past few months, the team at BonusInsider decided to explore online shoppers’ attitudes toward spending on this day.

Methodology

The survey was conducted online among 1,716 adults between 16 and 18 November this year, only a week before Black Friday and Cyber Monday, which comes right after the weekend. Black Friday has traditionally been the busiest day of the year for retailers in the United States, with some stores opening as early as 5 am. However, in recent years many customers prefer to shop online where it’s easier to compare prices and pick the best deals. For this reason, we only surveyed people who would be shopping online.

Nearly 60% Willing to Spend More Than They Planned

Despite countless warnings against overspending by experts both on TV and online, most shoppers are willing to disregard basic financial discipline when it comes to Black Friday shopping. Survey results show that 59.91% admit they would spend more than planned if they found good deals.

Only 5% of Black Friday Shoppers Planning to Spend More than $1,000

When asked about their budget for Black Friday shopping, most people said they are planning to spend between $200 and $1,000 – roughly 39% have a budget of $200 to $500 and 34% will spend $500 to $1,000. Approximately 13% of online shoppers are planning to spend between $100 and $200. Those who will make low-cost purchases of up to $100 make up 8.9% of all respondents, while only 87 shoppers, or roughly 5.1%, are planning to spend more than $1,000 on Black Friday this year.

Credit and Debit Cards Preferred by Majority of Shoppers

Despite the wide variety of modern methods for paying online, traditional credit and debit cards such as Mastercard and Visa are still preferred by many when shopping on the Internet. The most preferred method is the credit card, picked by 543 respondents (31.64%) in the survey, followed by e-wallets and mobile wallets like PayPal, Cash App or Venmo, picked by 507 shoppers (29.55%).

Another 344 respondents (20.05%) say they will use a debit card on Black Friday, while only 115 people (6.70%) choose to pay via bank transfer. An alternative to credit cards, the so-called BNPL (buy now, pay later) services are gaining popularity, although they’ve been around for just a few years. A total of 109 shoppers (6.35%) picked BNPL as their preferred payment method for Black Friday as they can pay for their order at a later date or spread payments over time, often interest-free. Others choose cash on delivery (3.7%) and various prepaid methods (2.04%) such as gift cards, prepaid vouchers, and digital cards.

Discounts More Important to Black Friday Shoppers Than Brands

This year’s inflation, reaching a 41-year high this past June in the US and exceeding 10% across most of Europe, has made shoppers more cautious of prices. Nearly 43% of respondents, 735 people, admit they will be shopping for the best deals on Black Friday, while only 639 say they will buy their preferred brands and products, regardless of the cost. 342 shoppers, roughly 20%, say the free shipping and return policies will matter more to them than the actual discounts they will get.

The Most Watched YouTube Videos and How Much Revenue They Generated

Created in 2005, YouTube has become the world’s most popular video streaming service. With 2.5 billion users each month, it has become a lucrative source of revenue for many content creators on the platform.

The site’s evolution has led to it becoming a full-time source of income for many creators. YouTube allows creators to monetise their content by displaying ads on their videos. As a result, the platform has the most favourable Cost Per Click (CPC) and Cost Per Mille (CPM) than any other social media platform. This is why thousands of creators have fled to YouTube as their platform of choice to upload their work.

The most viewed YouTube video created a revenue of $22 million, purely from views on the video and clicks on the ads. This has led BonusInsider to search for just how much money can be made off YouTube and what type of content attracts the most views on the platform. So, our team looked into the top 10 most watched YouTube videos and how much revenue they have made as of November 20th 2022.

Methodology

There are a few ways in which YouTube calculates the revenue from each video. The money paid to creators comes from the ads displayed on a video. The revenue of a YouTube video is calculated per every 1,000 views – this is CPM. Or, per CPC, which is how much the advertiser pays for every click on the ad. Therefore, we have calculated the revenue per view by combining the CPM and CPC to reach an estimated amount.

The average CPM is $7.60. We have calculated the revenue from each video using the Influencer Marketing Hub’s YouTube money calculator. Google takes a 45% share of YouTube advertising revenue. Therefore the content creator gets 55% of every dollar paid by advertisers. When Google takes its 45% from the average CPM of $7.60, creators get $4.18.

It is also important to note that it depends on what kind of ads creators have chosen to run on their videos. For example, video ads (played before the user’s video starts playing) are more profitable than banner ads (shown at the bottom of the screen whilst the video is playing). Therefore, please bear in mind when looking at the data that the revenue calculated is just an estimate.

10 Most Watched Youtube Videos

1. “Baby Shark Dance”, Pinkfong Kids Songs & Stories. Total Views: 11.65Bn Total Revenue: $22M

Baby Shark was the first video on YouTube to reach over 10Bn views, which still stands today. Created in 2016, Baby Shark started to gain popularity in 2017. However, it took four years for the video to overtake Despacito, which was the most-viewed video up to that point. Nevertheless, the 2-minute clip gained so much popularity that it spurred a viral online dance trend. It is estimated that the video made $22m just from views alone.

2. “Despacito”, Luis Fonsi featuring Daddy Yankee. Total Views: 8Bn Total Revenue: $15M

Released in 2017, Despacito quickly rose to the most-viewed YouTube video of all time. Soon overtaken by Baby Shark, Despacito has since then held second place with 8Bn views. Still, it took YouTube by storm and topped the charts in 47 countries and made it to the top 10 in another 6. So much so, that music legend Justin Bieber made a remix version just three months later. It is estimated that the video made $15m on YouTube.

3. “Johny Johny Yes Papa”, LooLoo Kids. Total Views: 6.5 Bn Total Revenue: $12M

Third on the ranking, reaching a revenue of $12M, is an English nursery rhyme. The video uploaded to YouTube in 2016 is about a child, Johny, who gets caught eating sugar by his father. It rose in popularity when posted by a kid’s YouTube channel called LooLoo kids. Previously it was thought that the video had been around since 2007.

4. “Shape of You”, Ed Sheeran. Total Views: 5.8 Bn Total Revenue: $11M

Chart-topping song, Shape Of You, by British icon Ed Sheeran is estimated to have made $11m on YouTube. Number 1 in 34 countries, the song won the Grammy for Best Pop Solo Performance in the 60th Grammy Award show. So, it is obvious why this worldwide hit reached such an impressive amount of views on Youtube.

5. “See You Again”, Wiz Khalifa featuring Charlie Puth. Total Views: 5.68 Bn Total Revenue: $11M

The pop hit by Wiz Khalifa featuring Charlie Puth was uploaded to YouTube in 2015. It quickly became both artists’ biggest single to date. See You Again held the top spot in 2017 for most viewed videos on YouTube before it was overtaken. Since then, it reached an estimated revenue of $11M.

6. “Bath Song” Cocomelon Nursery Rhymes. Total Views: 5.71 Bn Total Revenue: $11M

Close behind, the bath song was released in 2018. The children’s nursery rhyme is about bath time and aims to help children become more comfortable with taking a bath. Again, creating revenue of $11M, the video gained popularity in the parent community to encourage kids to take a bath.

7. “Phonics Song with Two Words” ChuChu TV. Total Views: 4.98 B Total Revenue: $9M

Another nursery rhyme gained popularity in 2014. Impressively, the Phonics Song was uploaded over eight years ago and is still gaining attraction today. Profiting from $9M in revenue, the video has done well to uphold the 7th position.

8. “Uptown Funk” Mark Ronson featuring Bruno Mars. Total Views: 4.74 Bn Total Revenue: $9M

Uptown Funk was directed by Mark Ronson and featured the famous American singer Bruno Mars. Heavily influenced by the early 1980s, it led to a number of lawsuits over copyright issues. It is speculated that the controversy surrounding the rights of the song led to an increase in the views of its YouTube video, resulting in an estimated revenue of $9M.

9. “Learning Colors – Colorful Eggs on a Farm” Мирошка ТВ. Total Views: 4.7 Bn Total Revenue: $9M

The Russian nursery rhyme released in 2018 quickly became popular. Many viewers didn’t understand how it could be one of the most viewed videos, claiming that there is barely anything in it content-wise. It is thought that this controversy helped the video gain 4.7Bn views and $9M in revenue.

10. “Gangnam Style” Psy. Total Views: 4.59 Bn Total Revenue: $8M

The South Korean K-pop singer Psy released the iconic song Gangnam style in 2012, making it the oldest video in the top 10. Impressively, a video that is ten years old is still one of the most viewed on YouTube to this day. Moreover, the catchy song came with a dance that went viral worldwide, helping it secure billions of views and $8M in revenue.

Conclusion

The common denominator of the videos in the top 10 is that they are all music videos. This suggests that music videos do better on YouTube than videos where creators talk – tutorials, product reviews, etc. After looking at the songs in the top 10, it is clear that many of their views come from repetition. The songs are likely to be played numerous times, helping them reach the extremely high numbers we see. Overall, the combined revenue made from the top 10 view videos was $117M. YouTube has opened a new stream of revenue for creators, which is now being replicated on platforms such as TikTok and Instagram.

BonusInsider is a leading website where you can find find expert reviews of casino bonuses, betting bonuses, casino deposit options and casino mobile apps.

A 6 kilometre section of the A23 is the UK’s deadliest road with 4.45 fatal crashes per kilometre each year

Every year, more than 1,700 people are killed in accidents on Britain’s roads, a figure that has remained relatively consistent over the past decade. While this sounds like a lot considering the constant improvements in road safety, statistics show that fewer people are killed or seriously injured on the roads than ever before.

In 1941, while the country was fighting World War II 9,169 people lost their lives in road accidents, the highest recorded fatality rate since the first national figures were published in 1926. The highest peacetime fatality rate was recorded in 1966, when 7,985 people lost their lives on the roads. What do current figures show, and which are the most dangerous roads in the UK? BonusInsider has extracted data for all road accidents in the UK for the past ten years, in order to identify the deadliest roads on which to travel.

Slight Increase in Traffic Deaths in 2021

In 2021, there were 101,087 traffic accidents resulting in personal injury in Great Britain, according to the Department for Transport. Fortunately, most of them, or roughly 77.5%, did not result in serious injuries. More than a fifth (21.06%) of the crashes were considered serious, while 1,474 of the collisions (1.46%) were fatal. The data shows that 1,608 people were killed in these accidents across the United Kingdom – 1,558 lost their lives in Great Britain and another 50 died in Northern Ireland.

This is an increase of 6.07% compared to 2020, when the pandemic slowed down most of our lives, and led to less traffic and subsequently, fewer casualties on the roads. Still, compared to pre-pandemic levels, traffic fatalities are significantly fewer – exactly 200 fewer deaths from 2019, which is a drop of 11.06%.

Methodology

To collect data for this report, BonusInsider analysed the latest road traffic statistics published by the Department for Transport. These are based on Police STATS19 reports that have been filed for all road accidents which resulted in personal injury. Population data for England and Wales was taken from official government statistics of the 2021 Census, while for Scotland, data for 2020 published by the local councils was used. Most statistics for Northern Ireland, however, are published separately and include different details on traffic accidents. For this reason, some of the infographics created feature data for England, Scotland, and Wales alone.

For the list of the deadliest roads, data was collected from the Road Safety Foundation and its report “Building Back Safer. British EuroRap: Crash Risk Mapping Results 2021”, which includes the latest available figures by the Foundation, as well as data from the European Road Assessment Programme.

South East is the Most Dangerous Region

The regions of England where most people lost their lives in road accidents in 2021 were the South East (235 fatalities), the North West (190 fatalities), and the South West (168 fatalities). 51 people were killed in crashes in the North East, and another 75 died in London, making these the “safest” regions of England. In total, there were 1,329 fatalities in 1,254 accidents across England, another 143 fatalities in Scotland, 86 in Wales and 50 in Northern Ireland.

Region Accidents 2012 2013 2014 2015 2016 2017 2018 2019 2020 2021
North East Fatal 71 70 56 58 53 57 51 71 62 45
North West Fatal 157 143 177 172 179 164 184 187 151 177
Yorkshire and The Humber Fatal 137 152 143 131 130 147 165 169 141 146
East Midlands Fatal 158 136 155 167 181 170 179 185 128 150
West Midlands Fatal 160 146 153 150 152 172 167 142 104 128
East of England Fatal 172 168 174 177 197 188 163 167 158 155
London Fatal 134 126 128 133 114 131 109 120 94 73
South East Fatal 219 224 227 225 265 240 237 205 227 218
South West Fatal 187 180 173 160 154 168 172 157 123 162
Country Accidents 2012 2013 2014 2015 2016 2017 2018 2019 2020 2021
England Fatal 1,395 1,345 1,386 1,373 1,425 1,437 1,427 1,403 1,188 1,254
Wales Fatal 86 104 94 91 95 98 95 97 70 82
Scotland Fatal 156 159 178 152 175 141 149 158 133 138
Northern Ireland Fatal 45 55 74 69 65 62 53 53 51 47
TOTAL Fatal 1,682 1,663 1,732 1,685 1,760 1,738 1,724 1,711 1,442 1,521

Most Accidents Occur in Daylight and in Fine Weather

The traffic data shows that most accidents, nearly 73%, occur in daylight, which makes sense, considering there is more traffic during the day. Nearly 19.7% of the crashes in 2021 happened during the night when vehicles had their lights turned on – in only 0.7% of the cases, the lights were turned off.

Interestingly, the weather conditions were good when 80.8% of all accidents occurred, compared to a little over 11.3% happening in rainy weather, 0.7% while it was snowing, and only 0.4% in mist or fog.

It is also worth noting that nearly 70% of all collisions occurred on roads where the speed limit is 30 mph – these are typically roads in urban areas. Only 3.35% of the accidents happened on motorways.

Britain’s Counties with the Most Traffic Fatalities per Capita

The Department for Transport publishes detailed data on traffic accidents, as reported by the different counties and city councils, thus making it possible to identify the counties with the most traffic fatalities per capita. According to the figures of the past 10 years, the City of London has the highest road fatality rate in all of Great Britain – 18.6 deaths per capita, or 18.6 fatalities per 10,000 residents, which is twice as high as the rates of other counties.

The explanation is quite simple – the City of London is the smallest ceremonial county in the UK. Covering a mere 1.12 sq mi, it has a population of 8,600, being mainly a business-oriented area. The country’s financial and trading sectors are largely based in the City, along with numerous office buildings and company headquarters, generating a lot of traffic. Very few people actually live in the City.

Rank Local Authority Region/Country Number of Traffic Fatalities (2012 – 2021) Population Traffic Fatalities per 10,000 residents
1 City of London London 16 8,600 18.60465116
2 Northamptonshire East Midlands 307 359,500 8.539638387
3 Argyll & Bute Scotland 72 85,570 8.414163842
3 Powys Wales 112 133,200 8.408408408
4 Rutland East Midlands 34 41,000 8.292682927
5 Orkney Islands Scotland 18 22,400 8.035714286
6 Highland Scotland 172 235,430 7.305780912
7 Scottish Borders Scotland 77 115,240 6.68170774
8 Dumfries and Galloway Scotland 97 148,290 6.541236766
9 Stirling Scotland 57 94,080 6.058673469
10 Perth & Kinross Scotland 92 151,910 6.056217497
11 Lincolnshire East Midlands 465 768,400 6.051535659
12 North Yorkshire Yorkshire and Humberside 363 615,400 5.898602535
13 Aberdeenshire Scotland 145 260,780 5.56024235
14 Gwynedd Wales 64 117,400 5.451448041
15 Cumbria North East 267 499,800 5.342136855
16 Monmouthshire Wales 49 93,000 5.268817204
17 North Lincolnshire Yorkshire and Humberside 83 169,700 4.89098409
18 Shropshire West Midlands 154 323,600 4.758961681
19 Denbighshire Wales 45 95,800 4.697286013
20 Northumberland North East 148 320,600 4.616344354

*Does not include data for Northern Ireland

Northamptonshire, a county in the East Midlands with a population of 359,500, has the second-highest traffic fatality rate – 307 deaths or a rate of 8.54 deaths per 10,000 residents. Scotland’s Argyll & Bute and Powys in Wales follow with a rate of roughly 8.51 fatalities per 10,000 residents, and the fourth-highest rate (8.3 per capita) was recorded in Rutland, a county in the East Midlands.

The Deadliest Roads in Great Britain

According to the UK charity Road Safety Foundation, there are 37 “persistently higher risk” rural roads and 34 high risk urban roads in Great Britain. The organisation, whose aim it is to reduce road casualties, collects traffic data for all roads in England, Wales, and Scotland (and recently, for Northern Ireland). It calculates the risk of serious accidents for each road by comparing its length and the number of fatal crashes that have historically occurred on it.

With 26.7 fatal or serious crashes per km occurring between 2014 and 2019, the A23 from London to Brighton is the most dangerous road in Great Britain – a 6 kilometre section alone has seen 160 fatal accidents over the past few years.

Road # Local Road Authority Route Road Type Road Length (in km) Fatal and
adjusted serious crashes
(2014-2016)
Fatal and
adjusted serious crashes
(2017-2019)
Fatal/Serious Crashes
per km
(2014-2019)
A23 Lambeth Between the A205 near Streatham Hill and the A235 in Thornton Heath Mixed Urban 6 92 68 26.66666667
A259 Brighton and Hove Between the A293 and Arundel Road Mixed Urban 8 49 49 12.25
A23 Brighton and Hove Between the A27 near Patcham and the A259 in Brighton and Hove Single Urban 10 49 58 10.7
A205 Richmond upon Thames (58%)
Wandsworth (34%)
Hounslow (8%)
Between the A3 West Hill and the roundabout with the M4 junction 1
and the A4
Single Urban 9 43 50 10.33333333
A2030 Portsmouth Between the A3 in Portsmouth and the A288 near Milton Mixed Urban 5 19 30 9.8
A270 Brighton and Hove Between Lewes Road Cemetery and Stoney Lane Mixed Urban 12 44 48 7.666666667
A21 Highways England Between the A2100 in East Sussex and the East Sussex / Kent border Single Rural 22 33 31 2.909090909
A3057 Hampshire (85%)
Southampton (15%)
“Between the A303 near Andover and the A33 near Southampton Central
railway station
Single 37 51 52 2.783783784
A85 Transport Scotland Between the A816 south of Oban and the A828 in North Connel Single Rural 9 14 9 2.555555556
A199 East Lothian Between the A1 near Dolphingstone Farm and the A1/B6471 west of Haddington Single 11 9 17 2.363636364
A671 Lancashire Between the A646 near Burnley and Healey Hall Wood Single 18 19 19 2.111111111
A1028 Lincolnshire Between the A16 and the A158 near Spilsby Single 9 7 10 1.888888889
A58 Calderdale (74%)
Rochdale (26%)
Between the A646 near Halifax and the A6033 in Littleborough Single 19 13 22 1.842105263
A3055 Isle of Wight Between the A3054 near Freshwater and the A3054 in Ryde Single 51 50 42 1.803921569
A6094 Midlothian Between the A7 near Bonnyrigg and the A701 in Leadburn Single 15 15 12 1.8
A151 Lincolnshire Between the A15 in Bourne and the A16 near Spalding Single 22 14 25 1.772727273
A489 Welsh Government Between the A487 near Machynlleth and the A483 in Newtown
(two sections, split by the A470)
Single Rural 18 14 17 1.722222222
A683 Lancashire Between the A6 in Lancaster and the A65 near Kirkby Lonsdale Single 25 20 23 1.72
A82 Transport Scotland Between the A83 in Tarbet and the A85 near Clifton Single 35 27 23 1.428571429

*Does not include data for Northern Ireland

Survey Reveals the Online Spending Behaviour of Ethereum Holders After the Merge

The long-awaited Ethreum Мerge took place on September 15 with shifting Ethereum’s existing proof-of-world consensus mechanism to a proof-of-stake model. With this major upgrade, the Ethereum network managed to significantly cut its carbon footprint and decrease its network power consumption by over 99.9%.

The BonusInsider team decided to analyse the impact of the Merge on Ethereum holders’ behaviour and whether it affects the number of transactions they make. We noticed the number of daily transactions decreased by 9% between September 15 and October 31, 2022 (57,421,667 txs) and the same period last year (52,841,636 txs). This motivated us to commission a survey to understand more about the online spending behaviour of Ethereum holders after the merge.

Between 1st and 4th of November 2022 we surveyed 1,225 Ethereum adopters to find out how they spend their coins and how many transactions per month they send. Look at the questions we asked and the answers we obtained.

How many Ethereum transactions do you send per month?

Answer People Percentage
None 389 31.7%
1-9 505 41.2%
10-19 220 17.9%
20+ 111 9%

The vast majority of Ethereum holders are not actively trading or using their crypto very often, as 72.9% of them send no or less than 10 transactions a month. A total of 505 people, which is more than 40% of the survey respondents, admit they send only 1 to 9 Ethereum transactions per month, while nearly 18% say they send 10 to 19 transactions. Those making the most transactions, over 20 a month, are less than 10% of all respondents, or exactly 111 Ethereum holders. Interestingly, 389 of all people, or a little over 30%, say they don’t send any transactions.

How do you use Ethereum?

Hold Ethereum with investment purposes: 389 or 31.8%

Although experts point out that crypto isn’t ideal for investment due to its high volatility, many people still hold Ether as an investment. This group of people hope to profit from the rise in price after a certain period of time.

Speculate on the Markets: 330 or 26.9%

This group of holders use Ethereum to speculate on the markets and actively trade other crypto coins through it. They speculate on the price movements of other cryptocurrencies, or buy and sell the underlying coins. Even though it is considered a high risk activity, crypto trading is extremely popular among this group of holders.

Pay for services and shopping online 223 or 18.2%

Another important use of Ethereum is paying for services or buying products through ecommerce sites. For many people, its utility as an actual method for payments is obvious and they usually prefer to use it for paying for hosting, domain names, different IT services or to pay freelancers for work.

Buy NTFs 95 or 7.8%

Many of the cryptocurrency’s proponents use Ethereum to buy NFTs (Non-fungible tokens) since they are usually held on the Ethereum blockchain. This can be done through a major marketplace such as Coinbase, OpenSea, and Binance or in private deals without the mediation service of online platforms. Non-fungible tokens or NFTs are cryptographic tokens that exist on a blockchain. They cannot be replicated in any way, hence, they can certify ownership and authenticity.

Play P2E (play-to-earn) games 78 or 6.4%

The so-called P2E or play-to-earn games have also exploded in popularity in the past few years. They use a different model of the traditional games where you are usually required to pay in order to play. The concept behind the P2E games is simple: players collect cryptocurrencies or NFTs produced in the blockchain-based game. Popular titles right now are Calvaria, Silks, Tamadoge, and Axie Infinity.

Online gambling and betting 65 or 5.3%

Another group of Ethereum holders use their crypto to make safe and reliable deposits at gambling sites, including online casinos, sportsbooks, and fantasy sports platforms. Some websites specifically cater to crypto holders but there are also many traditional online gambling platforms that accept Ether as form of payment. Cryptocurrencies have several benefits to other payment methods – they are decentralised, so no bank would ever stop a transaction, they are extremely safe and reliable unlike card payments that can be denied sometimes, and they are almost anonymous.

Buy items in the metaverse 45 or 3.6%

Many people prefer using Ethereum to buy tokens on different metaverse platforms and use them to purchase virtual land or various other goods and services.

The metaverse, an immersive virtual world where anything is theoretically possible, is an exciting concept that is still being developed by several technology companies. You can access it through a PC or you may need a VR headset or augmented reality glasses. And usually, you need crypto to buy different items in the metaverse.

BonusInsider is a leading website where you can find find expert reviews of casino bonuses, betting bonuses, casino deposit options and casino mobile apps.