
Every year, more than 1,700 people are killed in accidents on Britain’s roads, a figure that has remained relatively consistent over the past decade. While this sounds like a lot considering the constant improvements in road safety, statistics show that fewer people are killed or seriously injured on the roads than ever before.
In 1941, while the country was fighting World War II 9,169 people lost their lives in road accidents, the highest recorded fatality rate since the first national figures were published in 1926. The highest peacetime fatality rate was recorded in 1966, when 7,985 people lost their lives on the roads. What do current figures show, and which are the most dangerous roads in the UK? BonusInsider has extracted data for all road accidents in the UK for the past ten years, in order to identify the deadliest roads on which to travel.
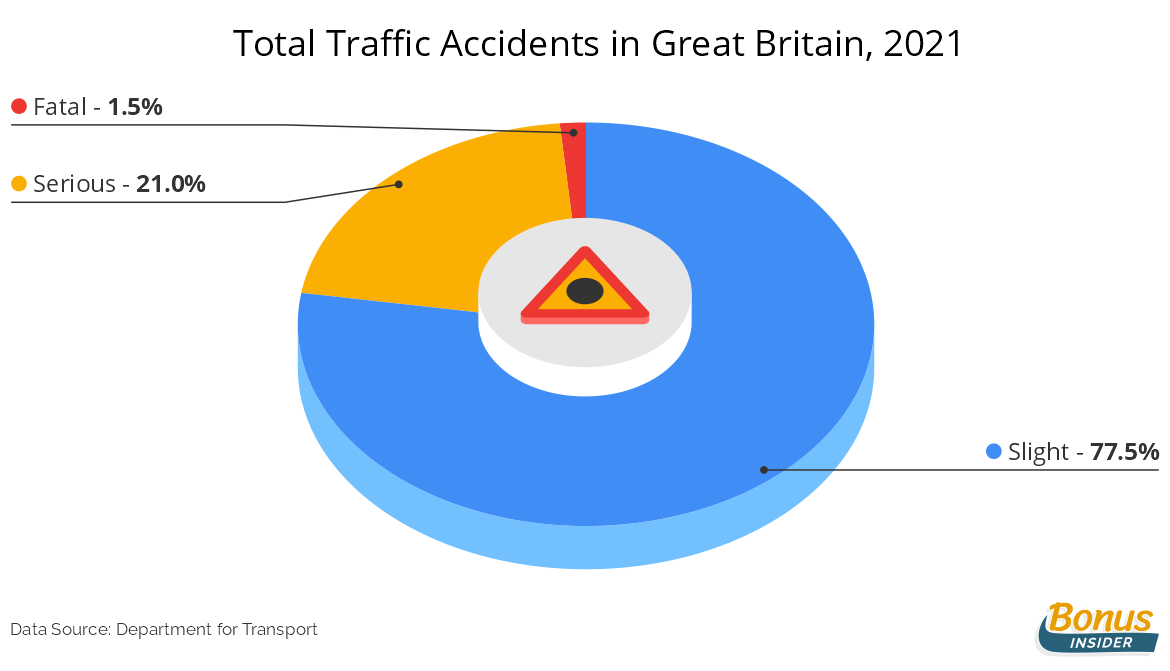
Slight Increase in Traffic Deaths in 2021
In 2021, there were 101,087 traffic accidents resulting in personal injury in Great Britain, according to the Department for Transport. Fortunately, most of them, or roughly 77.5%, did not result in serious injuries. More than a fifth (21.06%) of the crashes were considered serious, while 1,474 of the collisions (1.46%) were fatal. The data shows that 1,608 people were killed in these accidents across the United Kingdom – 1,558 lost their lives in Great Britain and another 50 died in Northern Ireland.
This is an increase of 6.07% compared to 2020, when the pandemic slowed down most of our lives, and led to less traffic and subsequently, fewer casualties on the roads. Still, compared to pre-pandemic levels, traffic fatalities are significantly fewer – exactly 200 fewer deaths from 2019, which is a drop of 11.06%.
Methodology
To collect data for this report, BonusInsider analysed the latest road traffic statistics published by the Department for Transport. These are based on Police STATS19 reports that have been filed for all road accidents which resulted in personal injury. Population data for England and Wales was taken from official government statistics of the 2021 Census, while for Scotland, data for 2020 published by the local councils was used. Most statistics for Northern Ireland, however, are published separately and include different details on traffic accidents. For this reason, some of the infographics created feature data for England, Scotland, and Wales alone.
For the list of the deadliest roads, data was collected from the Road Safety Foundation and its report “Building Back Safer. British EuroRap: Crash Risk Mapping Results 2021”, which includes the latest available figures by the Foundation, as well as data from the European Road Assessment Programme.
South East is the Most Dangerous Region
The regions of England where most people lost their lives in road accidents in 2021 were the South East (235 fatalities), the North West (190 fatalities), and the South West (168 fatalities). 51 people were killed in crashes in the North East, and another 75 died in London, making these the “safest” regions of England. In total, there were 1,329 fatalities in 1,254 accidents across England, another 143 fatalities in Scotland, 86 in Wales and 50 in Northern Ireland.
| Region | Accidents | 2012 | 2013 | 2014 | 2015 | 2016 | 2017 | 2018 | 2019 | 2020 | 2021 |
|---|---|---|---|---|---|---|---|---|---|---|---|
| North East | Fatal | 71 | 70 | 56 | 58 | 53 | 57 | 51 | 71 | 62 | 45 |
| North West | Fatal | 157 | 143 | 177 | 172 | 179 | 164 | 184 | 187 | 151 | 177 |
| Yorkshire and The Humber | Fatal | 137 | 152 | 143 | 131 | 130 | 147 | 165 | 169 | 141 | 146 |
| East Midlands | Fatal | 158 | 136 | 155 | 167 | 181 | 170 | 179 | 185 | 128 | 150 |
| West Midlands | Fatal | 160 | 146 | 153 | 150 | 152 | 172 | 167 | 142 | 104 | 128 |
| East of England | Fatal | 172 | 168 | 174 | 177 | 197 | 188 | 163 | 167 | 158 | 155 |
| London | Fatal | 134 | 126 | 128 | 133 | 114 | 131 | 109 | 120 | 94 | 73 |
| South East | Fatal | 219 | 224 | 227 | 225 | 265 | 240 | 237 | 205 | 227 | 218 |
| South West | Fatal | 187 | 180 | 173 | 160 | 154 | 168 | 172 | 157 | 123 | 162 |
| Country | Accidents | 2012 | 2013 | 2014 | 2015 | 2016 | 2017 | 2018 | 2019 | 2020 | 2021 |
|---|---|---|---|---|---|---|---|---|---|---|---|
| England | Fatal | 1,395 | 1,345 | 1,386 | 1,373 | 1,425 | 1,437 | 1,427 | 1,403 | 1,188 | 1,254 |
| Wales | Fatal | 86 | 104 | 94 | 91 | 95 | 98 | 95 | 97 | 70 | 82 |
| Scotland | Fatal | 156 | 159 | 178 | 152 | 175 | 141 | 149 | 158 | 133 | 138 |
| Northern Ireland | Fatal | 45 | 55 | 74 | 69 | 65 | 62 | 53 | 53 | 51 | 47 |
| TOTAL | Fatal | 1,682 | 1,663 | 1,732 | 1,685 | 1,760 | 1,738 | 1,724 | 1,711 | 1,442 | 1,521 |
Most Accidents Occur in Daylight and in Fine Weather
The traffic data shows that most accidents, nearly 73%, occur in daylight, which makes sense, considering there is more traffic during the day. Nearly 19.7% of the crashes in 2021 happened during the night when vehicles had their lights turned on – in only 0.7% of the cases, the lights were turned off.

Interestingly, the weather conditions were good when 80.8% of all accidents occurred, compared to a little over 11.3% happening in rainy weather, 0.7% while it was snowing, and only 0.4% in mist or fog.
It is also worth noting that nearly 70% of all collisions occurred on roads where the speed limit is 30 mph – these are typically roads in urban areas. Only 3.35% of the accidents happened on motorways.
Britain’s Counties with the Most Traffic Fatalities per Capita
The Department for Transport publishes detailed data on traffic accidents, as reported by the different counties and city councils, thus making it possible to identify the counties with the most traffic fatalities per capita. According to the figures of the past 10 years, the City of London has the highest road fatality rate in all of Great Britain – 18.6 deaths per capita, or 18.6 fatalities per 10,000 residents, which is twice as high as the rates of other counties.
The explanation is quite simple – the City of London is the smallest ceremonial county in the UK. Covering a mere 1.12 sq mi, it has a population of 8,600, being mainly a business-oriented area. The country’s financial and trading sectors are largely based in the City, along with numerous office buildings and company headquarters, generating a lot of traffic. Very few people actually live in the City.
| Rank | Local Authority | Region/Country | Number of Traffic Fatalities (2012 – 2021) | Population | Traffic Fatalities per 10,000 residents |
|---|---|---|---|---|---|
| 1 | City of London | London | 16 | 8,600 | 18.60465116 |
| 2 | Northamptonshire | East Midlands | 307 | 359,500 | 8.539638387 |
| 3 | Argyll & Bute | Scotland | 72 | 85,570 | 8.414163842 |
| 3 | Powys | Wales | 112 | 133,200 | 8.408408408 |
| 4 | Rutland | East Midlands | 34 | 41,000 | 8.292682927 |
| 5 | Orkney Islands | Scotland | 18 | 22,400 | 8.035714286 |
| 6 | Highland | Scotland | 172 | 235,430 | 7.305780912 |
| 7 | Scottish Borders | Scotland | 77 | 115,240 | 6.68170774 |
| 8 | Dumfries and Galloway | Scotland | 97 | 148,290 | 6.541236766 |
| 9 | Stirling | Scotland | 57 | 94,080 | 6.058673469 |
| 10 | Perth & Kinross | Scotland | 92 | 151,910 | 6.056217497 |
| 11 | Lincolnshire | East Midlands | 465 | 768,400 | 6.051535659 |
| 12 | North Yorkshire | Yorkshire and Humberside | 363 | 615,400 | 5.898602535 |
| 13 | Aberdeenshire | Scotland | 145 | 260,780 | 5.56024235 |
| 14 | Gwynedd | Wales | 64 | 117,400 | 5.451448041 |
| 15 | Cumbria | North East | 267 | 499,800 | 5.342136855 |
| 16 | Monmouthshire | Wales | 49 | 93,000 | 5.268817204 |
| 17 | North Lincolnshire | Yorkshire and Humberside | 83 | 169,700 | 4.89098409 |
| 18 | Shropshire | West Midlands | 154 | 323,600 | 4.758961681 |
| 19 | Denbighshire | Wales | 45 | 95,800 | 4.697286013 |
| 20 | Northumberland | North East | 148 | 320,600 | 4.616344354 |
*Does not include data for Northern Ireland
Northamptonshire, a county in the East Midlands with a population of 359,500, has the second-highest traffic fatality rate – 307 deaths or a rate of 8.54 deaths per 10,000 residents. Scotland’s Argyll & Bute and Powys in Wales follow with a rate of roughly 8.51 fatalities per 10,000 residents, and the fourth-highest rate (8.3 per capita) was recorded in Rutland, a county in the East Midlands.
The Deadliest Roads in Great Britain
According to the UK charity Road Safety Foundation, there are 37 “persistently higher risk” rural roads and 34 high risk urban roads in Great Britain. The organisation, whose aim it is to reduce road casualties, collects traffic data for all roads in England, Wales, and Scotland (and recently, for Northern Ireland). It calculates the risk of serious accidents for each road by comparing its length and the number of fatal crashes that have historically occurred on it.
With 26.7 fatal or serious crashes per km occurring between 2014 and 2019, the A23 from London to Brighton is the most dangerous road in Great Britain – a 6 kilometre section alone has seen 160 fatal accidents over the past few years.
| Road # | Local Road Authority | Route | Road Type | Road Length (in km) | Fatal and adjusted serious crashes (2014-2016) | Fatal and adjusted serious crashes (2017-2019) | Fatal/Serious Crashes per km (2014-2019) |
|---|---|---|---|---|---|---|---|
| A23 | Lambeth | Between the A205 near Streatham Hill and the A235 in Thornton Heath | Mixed Urban | 6 | 92 | 68 | 26.66666667 |
| A259 | Brighton and Hove | Between the A293 and Arundel Road | Mixed Urban | 8 | 49 | 49 | 12.25 |
| A23 | Brighton and Hove | Between the A27 near Patcham and the A259 in Brighton and Hove | Single Urban | 10 | 49 | 58 | 10.7 |
| A205 | Richmond upon Thames (58%) Wandsworth (34%) Hounslow (8%) | Between the A3 West Hill and the roundabout with the M4 junction 1 and the A4 | Single Urban | 9 | 43 | 50 | 10.33333333 |
| A2030 | Portsmouth | Between the A3 in Portsmouth and the A288 near Milton | Mixed Urban | 5 | 19 | 30 | 9.8 |
| A270 | Brighton and Hove | Between Lewes Road Cemetery and Stoney Lane | Mixed Urban | 12 | 44 | 48 | 7.666666667 |
| A21 | Highways England | Between the A2100 in East Sussex and the East Sussex / Kent border | Single Rural | 22 | 33 | 31 | 2.909090909 |
| A3057 | Hampshire (85%) Southampton (15%) | “Between the A303 near Andover and the A33 near Southampton Central railway station | Single | 37 | 51 | 52 | 2.783783784 |
| A85 | Transport Scotland | Between the A816 south of Oban and the A828 in North Connel | Single Rural | 9 | 14 | 9 | 2.555555556 |
| A199 | East Lothian | Between the A1 near Dolphingstone Farm and the A1/B6471 west of Haddington | Single | 11 | 9 | 17 | 2.363636364 |
| A671 | Lancashire | Between the A646 near Burnley and Healey Hall Wood | Single | 18 | 19 | 19 | 2.111111111 |
| A1028 | Lincolnshire | Between the A16 and the A158 near Spilsby | Single | 9 | 7 | 10 | 1.888888889 |
| A58 | Calderdale (74%) Rochdale (26%) | Between the A646 near Halifax and the A6033 in Littleborough | Single | 19 | 13 | 22 | 1.842105263 |
| A3055 | Isle of Wight | Between the A3054 near Freshwater and the A3054 in Ryde | Single | 51 | 50 | 42 | 1.803921569 |
| A6094 | Midlothian | Between the A7 near Bonnyrigg and the A701 in Leadburn | Single | 15 | 15 | 12 | 1.8 |
| A151 | Lincolnshire | Between the A15 in Bourne and the A16 near Spalding | Single | 22 | 14 | 25 | 1.772727273 |
| A489 | Welsh Government | Between the A487 near Machynlleth and the A483 in Newtown (two sections, split by the A470) | Single Rural | 18 | 14 | 17 | 1.722222222 |
| A683 | Lancashire | Between the A6 in Lancaster and the A65 near Kirkby Lonsdale | Single | 25 | 20 | 23 | 1.72 |
| A82 | Transport Scotland | Between the A83 in Tarbet and the A85 near Clifton | Single | 35 | 27 | 23 | 1.428571429 |
*Does not include data for Northern Ireland